Hello and welcome to the second section on the forex trading course.
In the previous section, you learned what the foreign exchange market is all about. You also got a glimpse into what forex trading is all about.
Armed with the basics of forex trading, this section introduces you to the next part.
How do you trade forex?
To answer this question, you need to know how you can analyze the markets. Unlike stocks, where you study the balance sheet of a company, the forex markets are different.
As you may guess, in forex, we study the macroeconomics of a country or an economy.
There are two main schools of analysis in forex.
- Fundamental analysis
- Technical analysis
Both these types of studies are different from each other. Yet, they take you toward the same goal, which is to predict price.
Let’s start with fundamental analysis in forex.
What is Forex fundamental analysis?
Forex fundamental analysis studies the underlying factors responsible for driving the value of a currency.
Fundamental analysis in forex is quite different from technical analysis. Investors use fundamental analysis to study how economic data impacts monetary policy.
Interest rates are responsible for driving the value of a currency in relation to the other.
The interest rates are set by a country's central bank. This is done by assessing the economic indicators. This helps policymakers to decide whether interest rates should rise or fall.
An economy is strong, as assessed by economic indicators like the GDP, inflation, unemployment, and balance of trade.
In forex trading, fundamental analysis can help you gain familiarity with a currency. Let's take a look at how fundamental analysis in forex is used by traders.
What's in an economic calendar?
In forex trading, the economic calendar plays a major role in fundamental analysis.
The economic calendar is a schedule of events over a period of time. These events are economic indicator releases from the respective statistics agencies.
The image below gives an example of an economic calendar.
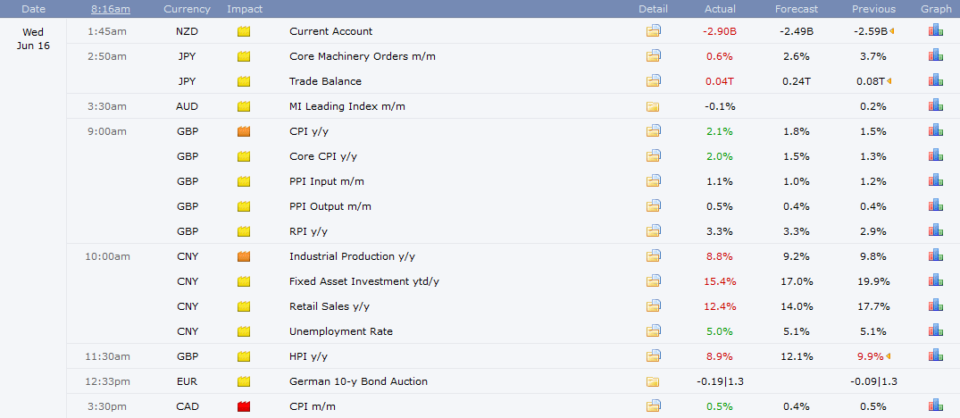
What you see in the above economic calendar are the following:
- Currency/Country: The ISO code of the currency and the country. Example, AUD/Australia
- Time/Date: The time and date of the economic indicator release
- Event name: The name of the economic event. Example: Consumer price index
- Expected: The expected headline print based on a survey of experts
- Previous: The previous data point of the last release of the economic event
How to use the economic calendar in fundamental analysis?
Trading decisions are taken based on the outcome of the economic data. However, not all economic indicators are the same. You have may have a few data points where a higher than expected print is good.
For example, the gross domestic product GDP is always better when it is higher than what investors expect. It is also good for the GDP to be higher than the previous release.
At the same time, there are a few economic indicators where a lower than expected headline print is good.
An example of this can be the unemployment data. Lower the unemployment rate, the better it is for the respective currency.
Most important economic indicators in fundamental analysis
Below are the top economic indicators that forex traders should keep an eye out for. For many forex traders, fundamental analysis can be intimidating.
But you don't need to be an economist to understand these figures when using fundamental analysis in forex.
These economic indicators will eventually decide when the interest rate for currency will be higher or lower.
Gross domestic product GDP: The gross domestic product is a measure of the total value of goods and services provided in the economy.
The GDP report is released on a monthly or quarterly period. This can change from one country to another.
The GDP report can sometimes be released as a preliminary report. This is followed by at least two revisions to the initial data.
Consumer price index or Inflation: The inflation or CPI data is directly linked to a central bank decision. Central banks can rein in inflation by raising interest rates. Likewise, to push inflation higher, the borrowing costs are cut.
Unemployment data: The unemployment data looks into the overall labor market in the economy.
In a growing economy, lower unemployment rate goes hand in hand with higher GDP growth. The unemployment data is released on a monthly basis and also includes data on wage growth.
Interest rate decisions: A country's central bank holds monetary policy meetings almost every month of the year.
The central bank decides during such meetings whether interest rates should rise or fall or kept unchanged. The interest rate decisions taken by the central banks are determined by the aforementioned economic data.
Speeches: Investors pay attention to speeches given by various heads of central banks. This can be via press conferences or speaking engagements. When a central bank's governor or other policymakers talk, the markets listen. Investors try to assess the speeches to forecast what the next interest rate decision may be.
How does fundamental analysis help you as a trader?
Many forex traders dismiss the importance of fundamental analysis in forex trading. This is partly due to the fact that not many traders can use this type of analysis.
But if you want to be successful as a trader in the forex market, then fundamental analysis is important.
Fundamental analysis will give you the reason why a currency pair was behaving the way it did.
Very often, this type of analysis will help you connect the dots as well.
The forex market is all about interest rates. And we know how interest rates are set. Applying fundamental analysis can help you gain more confidence.
You will also find more trading opportunities. Fundamental analysis can help you prepare towards having a better technical analysis outlook for the currency pair.
What is Forex technical analysis?
Forex technical analysis is the study of price history to predict future prices
Technical analysis is used not just in the forex market. It can be applied to any financial instrument that you want to trade.
Technical analysis traces its origins to Charles Dow. Dow is considered to be the father of technical analysis after his famous Dow theory.
Technical analysis combines different methods such as using indicators and observing historical price movements. Forex traders make use of indicators to determine what price was doing in the past. Based on this, they can determine how the price will behave when it approaches a previous price level.
There are many ways to bell a cat, and there are many ways to use technical analysis. The important point to note is that traders should have enough familiarity in using technical analysis in forex.
Very often, traders use technical analysis in isolation. But when you combine this with fundamental analysis, it can be a powerful tool.
What are technical indicators in forex?
Technical indicators form the basis of technical analysis. These indicators are mathematically derived. There is validity in using technical indicators to predict various aspects such as trend, volatility, and price.
Using a combination of technical indicators, forex traders are able to build a trading strategy. The trading strategy, which will you read about more is a set of rules.
Depending on how price behaves in relation to the technical indicators, traders determine whether they can buy or sell a currency pair.
While there are some standard forms of using these forex indicators, based on your imagination you can develop your own custom indicator if need be.
How to use technical analysis in forex trading?
You can use technical analysis in different ways. These can be classified into using an indicator-based approach, or simply a price-based approach.
Depending on one of the two, the tools that one uses can shape the data.
In a price-based approach, traders look at the price action. Price action is nothing but observing certain patterns that occur repeatedly in the market. There is an entire study dedicated to observing price action in the market.
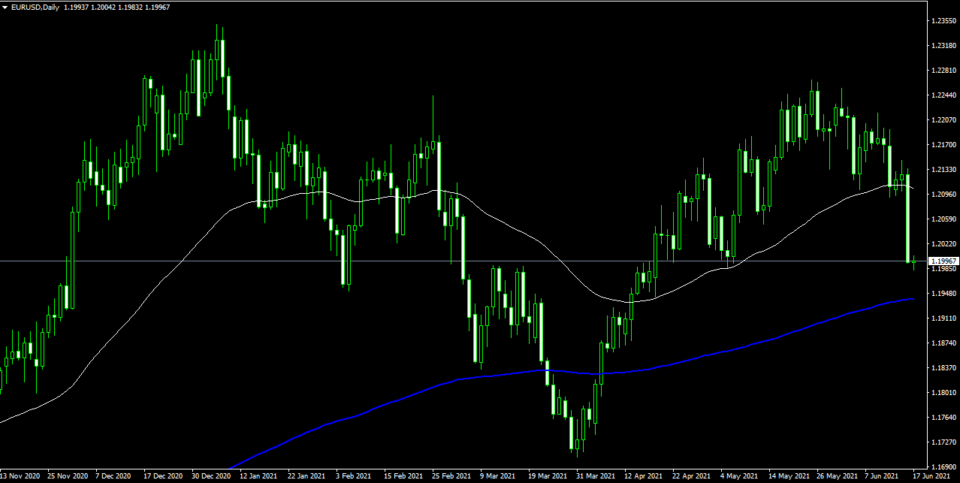
At the center of technical analysis is the price chart. The price chart makes use of a certain chart type called candlestick charts.
These look like a candle and have wicks or tails at the top or bottom of the candle body.
The picture below shows an example of a candlestick chart. You can see how some patterns keep occurring frequently.
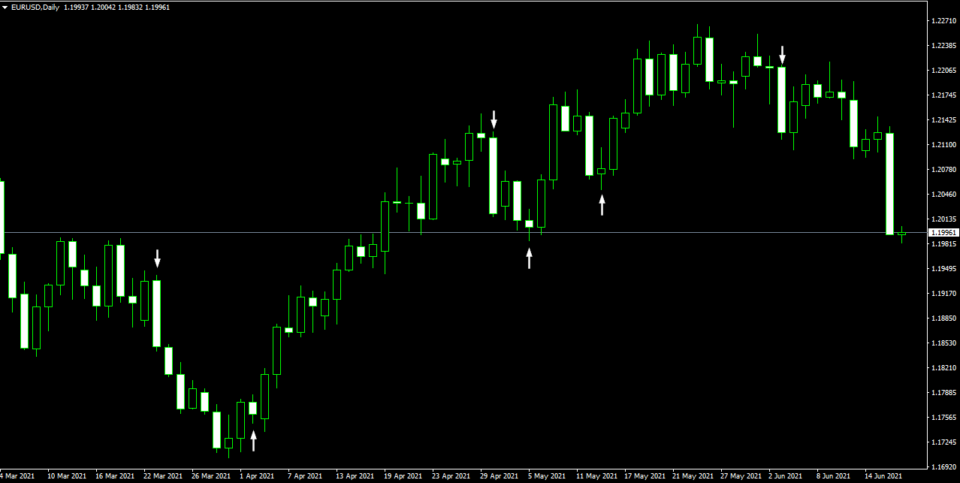
Depending on whether the price closed higher or lower from its open, the candles are bullish or bearish. And during the course, depending on how high or low the price moved, the wicks are formed.
The price chart simply shows the trader sentiment in the markets.
Besides the candlestick charts, other commonly used chart types include:
- Bar chart
- Line chart
- Area chart
- Price only charts (Renko, Kagi, Point and Figure)
Each of these chart types has its own pros and cons. You will learn about the types of forex charts in Part 3
Most important forex indicators in technical analysis
While you are free to use any technical indicator to trade, there are some indicators that dominate the world of technical analysis. These indicators are also the most basic and have stood the test of time.
If you are just getting started with forex trading, then it is essential for you to understand these very basic yet standard indicators.
Trend indicators
The trend indicators, as the name suggests are a set of tools that helps a trader to determine the trends in the market.
The most commonly used trend indicators are:
- Moving averages
- Parabolic Stop and Reverse (PSAR)
- Average Directional Movement Index (ADX)
There are many more, which you will discover in course of time. Besides using the trend indicators, the price itself can be used to determine the trends in the markets.
Oscillators
Technical oscillators in trading, as the name suggests move between fixed values. These values can range from 0 - 100 or from -100 to +100 or any other combination.
The purpose of oscillators in forex trading is to determine when a currency pair is overbought or oversold.
Prices do not move in a straight line. They frequently move back and forth forming a zig-zag shape. These are called corrections to the trend.
Therefore, oscillators are useful to help traders to determine when a correction is underway. Below are some examples of oscillators used in forex trading.
- Relative strength index (RSI)
- Stochastics oscillator
- Moving Average Convergence Divergence (MACD)
- Commodity channel index (CCI)
Volatility indicators
As the name suggests, volatility indicators show how volatile a forex pair is. This type of indicator helps you to understand the price movements. Using these indicators in forex trading, you can form an opinion on how high or low a currency pair may move.
Some commonly used volatility indicators are:
- Bollinger bands
- Chaikin volatility indicator
- Average True Range (ATR)
Chart patterns
Chart patterns is a study of some recurring patterns in price. These patterns based on their frequency and past behavior, predicts what price will do next. The chart patterns can occur on any time frame. But they are also very subjective.
Therefore, you should carefully consider when you want to jump into using chart patterns at the first instance. It takes a lot of practice to be able to read chart patterns.
Some commonly used chart patterns are as follows:
- Head and shoulders pattern
- Bullish and bearish flags and pennants
- Double top and double bottom
How can technical analysis in the forex market help you?
Technical analysis can help you especially if you combine other forms of fundamental analysis such as news analysis.
This method of analyzing currencies is useful if you want to speculate in the short to medium term. They work on any financial instruments including stocks and futures.
Technical analysis allows you to predict the direction of the instruments in question. Traders combine the different indicators in order to build a trading strategy.
What is better? Fundamental or technical analysis?
Now that you have a foundation in fundamental and technical analysis, the question is which one to use.
Traders debate on the merits of using one over the other. But this is incorrect.
Using just one form of analysis in forex trading means driving with just one side view mirror.
To be a successful forex trader, you need to make use of both these forms of market analysis.
Fundamental analysis answers the question of what is moving prices. Technical analysis answers the question of what price will do in the future.
When you marry these two concepts, you are able to get a better idea of what the markets are doing.
In the next section, we will look at the charts and also dig deeper into the concept of using a trading strategy.