Volatility in the financial markets is perhaps the most important aspect for day traders and speculators.
In fact, if you look at most of financial instruments, volatility is an important measure for that instrument. Based on how volatile an instrument is, it can determine the trading potential, and in some derivatives such as options, volatility can also determine its prices.
So, what is volatility in the first place?
Volatility is formally defined as the ability of a financial instrument’s price to change rapidly and most often unpredictably. A financial instrument with higher volatility also increases its risks.
If we dig deeper into the concept of risk management, volatility plays an important role in risk measures such as value at risk.
For example, if you plot a stock’s price and calculate its daily returns, then the standard deviation of daily returns is simply a measure of its volatility. You can also use the variance of the daily returns as another measure of volatility.
Thus, from the example, we can deduce that volatility is the level of dispersion of its returns.
When a financial instrument shows higher volatility, it means that it experiences large price changes. On one hand, this can be risky. But the flip side, traders have many opportunities to day trade.
When a financial instrument shows lower volatility or lower dispersion of returns, there isn’t much opportunity to make money.
The best way to illustrate this example is to look at any price chart.
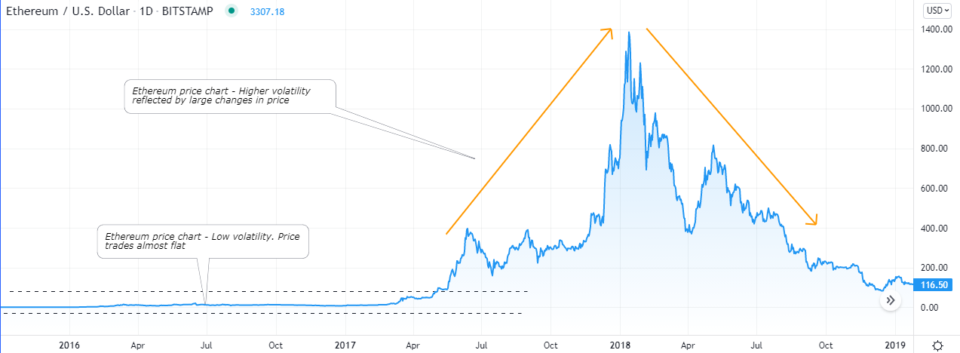
The above chart shows the early days of the Ethereum cryptocurrency. You can see how for nearly two and half years, the price remained flat.
Following this, there was a pop and ETH turned higher, increasing its volatility.
What does it mean to trade forex or stocks with higher volatility?
To put it simply, when you trade a financial instrument, be it forex currency pairs or stocks, traders prefer to pick those that have higher volatility.
An instrument with higher volatility tends to offer more trading opportunities than one that doesn’t!
This is especially true if you are day trading.
For example, if a currency pair X moves barely a few pips on a day-to-day basis, there is literally no opportunity to profit. On the other hand, if a currency pair Y tends to move 50 – 100 pips on average, this currency pair offers more opportunities for day trading.
The second currency pair is riskier than the first. But it goes hand in hand with the fact that you are typically compensated for the level of risk you can take, while trading.
Traders across all asset classes have experienced bouts of low volatility at some point. We generally call this a ranging market.
What is a ranging or sideways market?
The ranging or a sideways market also has another name called whipsaw. This is when the price tends to move within fixed price points.
Another name for this is accumulation. This is when the price of the instrument trades almost flat, relative to its past price movement.

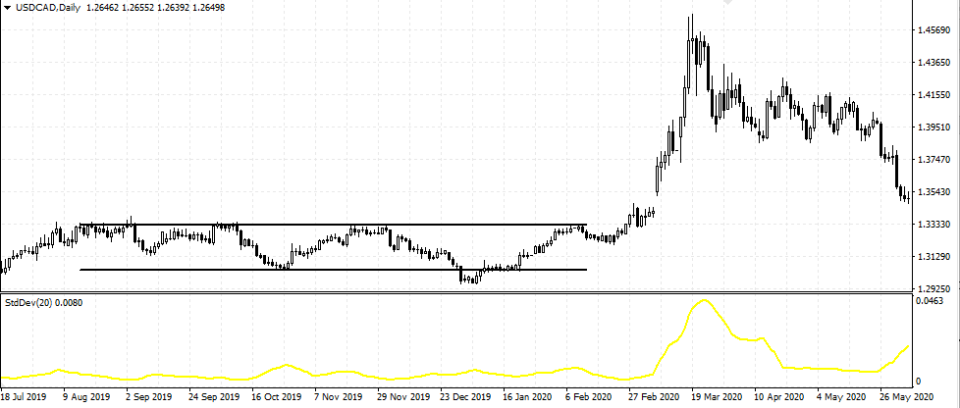
The USDCAD price chart above shows a similar example to that of the ETH price chart. The difference here is that we also plot its standard deviation.
What is the standard deviation?
Standard deviation is a measure of how dispersed a data set is from its mean. Standard deviation measures the absolute variability. Higher the variability, the higher its standard deviation, and vice versa.
A good visual way to understand the standard deviation is to plot a moving average on a financial instrument. In many cases, the price tends to trade close to its moving average.
This is when the standard deviation falls, leading to bouts of low volatility. But when price tends to disperse or deviate above or below its moving average, it signals higher volatility.
Going back to the example, the price area marked by the vertical lines shows prices moving within a fixed range. This period of low volatility is represented by the Standard deviation which falls close to zero.
But following this low volatility period, USDCAD then breaks out of its range. This is signaled by the standard deviation also rising higher.
Why is volatility important for traders?
As a day trader, it is important to understand the volatility (and standard deviation) for a number of reasons. Besides immediately getting a view of how much the security can move, volatility and the standard deviation are also used as technical indicators in trading.
Volatility can be derived through different statistics measures. The most common forms of measuring volatility are:
- Standard deviation
- Mean
- Variance
Based on these different forms, one can find different volatility indicators. Some of the most common technical indicators that measure volatility in one form, or another are:
Bollinger bands indicator
The Bollinger bands indicator is a set of three lines that resemble a moving average line. Indeed, the mid-line is a 20-day simple moving average.
The outer bands are +/= two standard deviations apart.
While the middle band tends to plot the 20-day average price, the outer bands are more elastic or flexible. These bands tend to contract and expand. These contractions and expansions are a result of rising and falling volatility.
You may come across many technical analysis and trading strategy articles that tell you when to buy or sell using Bollinger bands.
But it is important to understand the causes behind these Bollinger band expansions and contractions are.
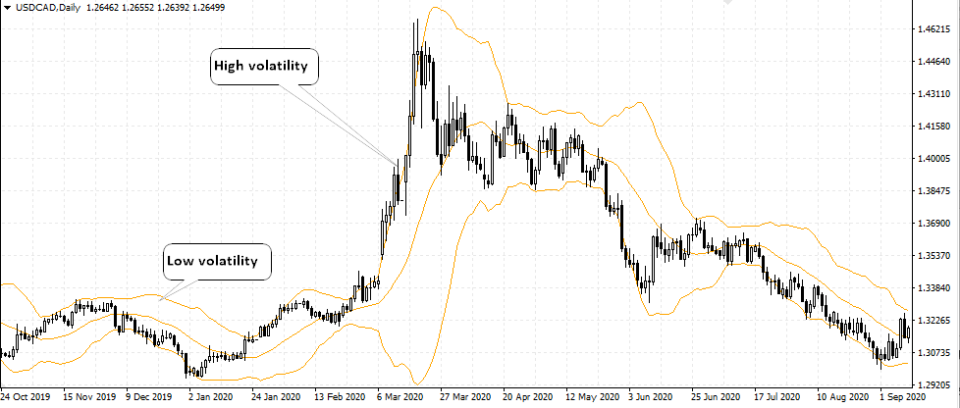
The chart above for USDJPY shows the period when the Bollinger bands contract and remain this way for a while. It happens when prices do not move much and there is clearly a lack of volatility as a result.
But following this, we see the Bollinger bands expanding. This coincides with a price breakout. As price moves rapidly, so does its volatility.
Standard deviation indicator
The standard deviation indicator is another measure of volatility. On the MT4 chart, this indicator acts like an oscillator. Meaning that it is plotted in the sub-window.
The Standard deviation indicator plots a continuous value as new price points emerge. When the standard deviation indicator rises, it means that there is higher volatility and thus the ability to spot day trading opportunities.
Conversely, when the standard deviation indicator falls, close to zero, it means that prices are barely moving.
It is important to note that you will not see a standard deviation value of zero. This would mean that price remains fixed without moving at all.
VIX – Volatility index
While there are many other different volatility indicators, the VIX is one indicator that has to be mentioned when talking about volatility.
VIX, which is short for the Volatility Index is a financial derivative instrument by itself. It is published by the CBOE (Chicago Board of Options Exchange). The VIX is a forward-looking indicator that measures the expected volatility, projected 30-days ahead.
The VIX represents the market’s expectations of the volatility on the S&P500 index. As you may know, the S&P500 index is a stock index that tracks the aggregated price movement of 500 blue-chip companies in the United States.
But unlike the more traditional volatility indicators, VIX is derived by the weighted average of the price of PUT and CALL options on the S&P500 index.
When investors are wary of the S&P500 falling, the number of PUT options bought increases. On the other hand, when investors are bullish, the number of CALL options rises, relative to the PUT options.
The above chart shows the S&P500 price chart on the main window and the VIX index in the sub-window.
You can see how the VIX rises, often coinciding with a large or a significant drop in the S&P500 index as well.
Hence, the VIX is a measure of volatility on the U.S. equity markets and shows whether the price of a financial instrument will rise or fall, relative to its past movement.
How to pick volatile markets
For day traders especially, it is important to have their pulse on volatile markets. Without a good price movement or volatility, there are literally no money-making opportunities.
Here are some ways traders can filter out more volatile financial instruments to lesser volatile ones. You can apply these methods to just about any market. It includes forex, stocks, futures and you can apply these concepts to CFD instruments as well.
Pick trending markets
Trending markets are those where price becomes unidirectional. This is seen by a strong rise or drop in the prices. Trends tend to play out over a period of days and even months (often seen in the commodity markets).
The trending markets tend to have higher volatility compared to less trending markets.
As a result, traders can find opportunities such as buying or selling into the trend or even taking a riskier approach of counter-trend trading.
Look for breakout trades
Breakout trades occur when the price is stuck in a tight range. Following this, quite often, there is a breakout. The breakout can happen in either direction.
Hence, traders should apply caution.
An important point about volatility is the fact that volatility can rise, irrespective of the direction of prices. Thus, higher volatility can signal a rising market and also a falling market.
To catch potential breakout trades, you could make use of indicators such as the Bollinger bands. These bands tend to contract and following this, you can expect to see a large breakout occurring.
A common misconception of using Bollinger bands is that it does not predict the direction of the breakout. The Bollinger band is reactive and thus follows the direction of the breakout itself.
Still, if you are able to catch the markets, the strong volatility can yield quick results. But it also comes at the risk of being wrong-footed. This can be expensive unless you are able to manage your stop loss (aka risk) efficiently.
Volatility is often triggered by undiscounted news
The Efficient market hypothesis, it states that price already reflects all the information that is available.
While this is true, volatility rises when there is some information that the markets have not yet discounted (unknown). A good example of this can be seen on instances such as the Swiss franc being de-pegged against the EUR.
Another more recent example was the Covid-19 news in the first quarter of 2020.
The event caught the market by surprise, leading to a sharp and rapid crash across all markets.
While it is difficult to predict when such events may occur, on a day-to-day basis, traders in the currency markets can look for clues.
Good examples include following the central bank speeches. Many a time, markets are caught off-guard and this can lead to a rapid increase in volatility. While monetary policy actions are well communicated beforehand, there are still moments, when there is a mismatch of expectations in the markets.
It is moments like these that can lead to a surge in volatility.
Thus, fundamentals play an important role when you want to hunt for volatility.
The importance of risk management when trading volatile markets
So far, we have learned what volatility is and how to measure volatility. We also covered the different technical indicators one can use. We also learned how you can spot potential trading opportunities as well as anticipating a rise in volatility.
While this is more than enough to get you set up to hunt for volatile markets, risk management is something that you should pay attention to.
Because prices can rise or fall sharply, volatile markets need special attention.
Quite often, there are instances when the markets make a fakeout.
A fakeout is when the price initially moves in one direction. This leads traders to open positions in that direction. But sooner than later, the price reverses direction. This catches all the weak positions and can cause havoc with your trading capital.
One might argue that using stop loss can help. But due to the volatility, you need to find a balance. Using a tight stop loss during volatile markets can lead to your trade being prematurely closed out. Using too wide a stop loss can mean having to digest wild swings in the market.
This can in turn impact your drawdown.
At the end of the day, a successful trader is one that can manage their risks. Trading volatile markets can indeed be a profitable way for day traders and speculators.
But as you take on higher risk, the potential to make greater profits or losses also increases.