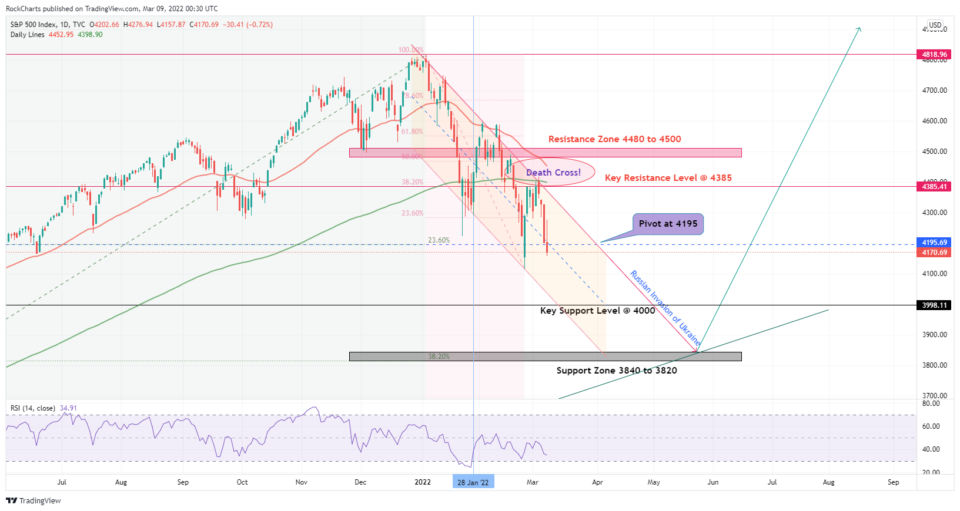
S&P500 Death Cross
S&P500 is reaching the infamous death cross indicating a potential for major sell-off in the stock market. The S&P500 Death Cross occurs when a short-term moving average (typically 50-day SMA) crosses over a major long-term moving average (typically 200-day SMA) towards the downside. And it is recognised as a definitive bear turn in the market.
Such selloffs then can lead to a more severe bear market as it happened in 1929, 1938, 1974, and 2008. S&P 500 was down by 0.72% about 30.39 points yesterday. The market recovered briefly on the reports that Ukraine is no longer looking for NATO membership. However, the US500 index gave up all the gains to finish the day in negative territory.
Dow Jones (DJIA) and the tech-heavy Nasdaq Composite Index have both already witnessed the Death Crosses recently. Bears are appearing to be in full control of the markets. The S&P500 has posted losses for the past four days in a row. As the Ukraine crisis and ware-related news everywhere is weighing heavy on Investor’s sentiments.
The fact that Putin is not going to stop till his demands are agreed upon or he has fully captured Ukraine to avoid losing face and criticism back home is increasing the geopolitical risks. The CBOE Volatility Index is climbing vertically and has already been hovering above the 35.00 mark. Click here to learn how to read the chart.

USO/USD
After President Joe Biden announced on Tuesday that the US will ban all Russian Oil imports to retaliate for the invasions of Ukraine, the Oil prices (WTI Crude Oil) jumped even higher to $129.00 per barrel. The Brent Crude Oil is up by roughly 35% in the last two weeks and it is the main source of cash flow for Russia, but this will also add to the cost to Americans when they are already struggling with higher commodity prices and rising inflation at 7.5% as of January 2022. The new inflation data is to be announced tomorrow (March 10th, 2022).
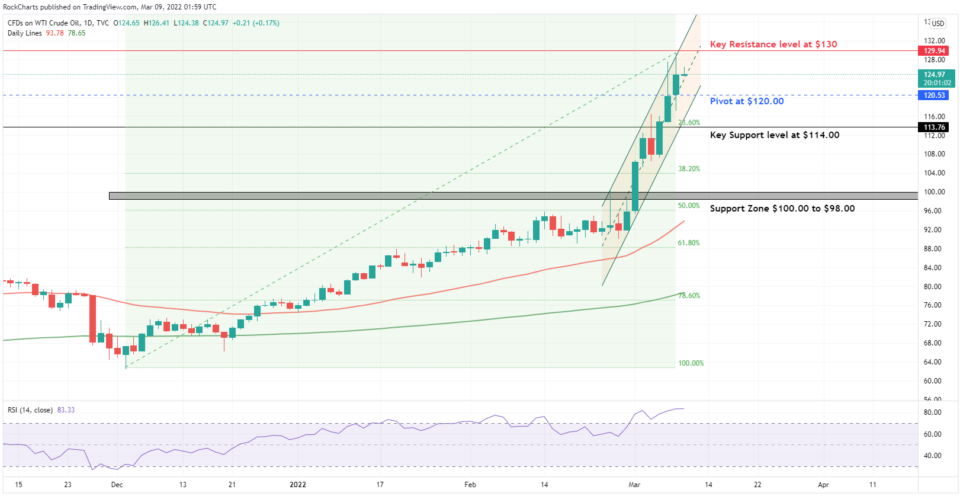
USO/USD Chart shows that the oil prices have made an attempt to breach the $130 resistance yesterday. If the Key Resistance level at $130 is broken, then after consolidation the $140 will come into the picture. This seems this target looks realistic at this stage. RSI indicator shows the Oil is already in overbought territory and showing no signs of weakness at this stage. If prices drop, then pivot at $120.00 is going be crucial to decide the direction of oil. The next support is at $114.00 and then the Support Zone has also shifted higher towards $100.00. If the Ukraine crisis is over in the next few weeks, the drop in oil prices will be sudden and deep.
XAU/USD
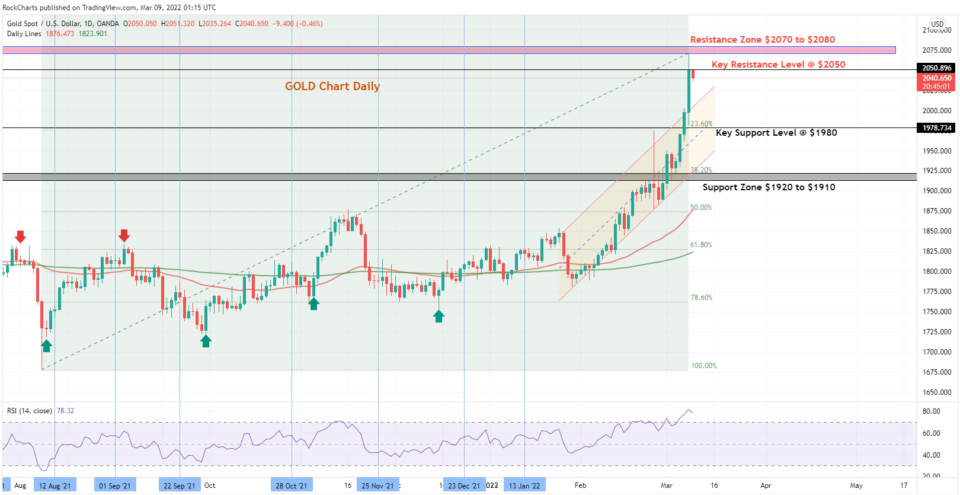
The gold prices just fell short of the all-time price of $2075 and retraced back from $2070 in yesterday’s gold rush session. The all-time high and even $2100 price for gold seems quite possible. Now as it just needs a greater escalation between the Russian and Ukraine crisis and its western response. The effect of US and European sanctions on Russia has been a dramatic surge in the commodity prices like oil is up by 35% and Wheat up by 45% in the past 2 weeks.
Trade Insights
XAU/USD –Viable Long positions above the Key Resistance Level $2050 targeting the Key Resistance at $2070 to $2080 and then later testing the Next Resistance level at $2100.
Alternatively, Short positions below the Key Resistance Level at $2050 on the chart to target $1980 first then the Support Zone at $1920 to $1910.
The chart shows that they are now dropping or maybe consolidating below the Key Resistance level at $2050. RSI indicator shows the prices have crossed the overbought level and are at just 82.00 points. Could Gold prices go on to touch the 85 points on the RSI is to be seen.