Among the many different economic indicators, the US Nonfarm Payrolls, or NFP for short are widely watched. The implications of the payrolls report or the jobs report are important, not just for economists and central bank officials.
The market volatility that comes on the back of the payrolls report also reaches across the trading community.
Given the subjectivity of the payrolls report, it is important for traders to not just rely on their trading strategies. One also needs to understand and interpret the payrolls report. There are many articles that talk about the payrolls report.
In this article, we break down what the US nonfarm payrolls report is all about, from a trader’s perspective. The goal of this article is to enable the reader to understand the report and also to watch for some key signs that the report gives you.
The investing community in general tends to react to the headline data and then digest it. This can lead to conflicting signals. Contrary to the popular opinion one may form, the payrolls report is not binary. It means that the markets simply won't just react in one way all the time for a positive read, and react differently to a negative read. The context of the report plays an important role. Having a good understanding of the payrolls report helps you to gain more confidence in your analysis.
This, combining the technical signals and your knowledge, you are able to better manage your risks, when trading the payrolls report.
But that is not all, the consequences of the payrolls report also have a far-reaching impact. At times, the payrolls report can shape the trend of the markets as well.
What is the US nonfarm payrolls report?
The US nonfarm payrolls report is a monthly jobs report released by the U.S. Bureau of Labor Statistics or BLS.
The nonfarm payroll is a jobs report showing the number of jobs added to, or lost from the economy each month. The jobs report also shows the official unemployment rate in the United States.
The reason why it is called the nonfarm payrolls is that it excludes the agricultural sector.
The report is released is on the first Friday of the month, covering the job market from the previous month. It impacts not just the currency markets, but also the bond markets and the equity markets. Hence, the US jobs report is perhaps one of the most important economic indicators that traders should track.
The report is a statistical compilation of surveys that the BLS conducts. The survey is usually conducted during the middle of the month, based on two sets of surveys.
- The first survey is based on the household population
- The second is based on employment data.
While the former is based on a survey directed towards individuals, while the latter is a survey of the employers directly.
These two sets of data tend to give a clearer picture of what the job market looks like. Since the jobs survey is concluded by the middle of the month, it tends to reflect the hiring trends between the previous month’s two last weeks and the current or survey month’s first two weeks.
Thus, in short, the US jobs report does not truly reflect the job market for the previous calendar month.
This is often stressed when a key event happens during the last two weeks of the month. The jobs report will not reflect this, until the next report release.
Why does the US jobs report exclude the agriculture sector?
According to this paper from the St. Louis Fed, the reason why the agriculture sector is excluded is that it is highly seasonal. Due to the seasonal fluctuations in the farming sector, tends to distort the data if included.
Furthermore, it is not just seasonality but also the accuracy of the data itself. Factors such as part-time farming, and self-employment in the agriculture sector tend to complicate data even further.
What are the key elements of the US nonfarm payrolls report?
There are four key elements or headline numbers that traders should keep an eye on. These include:
- Monthly payrolls
- Unemployment rate
- Wage growth
- Labor force participation rate
Monthly Payrolls
The monthly payroll is an absolute number showing the number of jobs added to the economy, or that were lost. In many cases, the monthly payroll is a positive number. It is also referred to as the Non-farm employment change.
For example, in May 2020, the US economy lost two million jobs, due to the Covid-19 pandemic and the resulting restrictions.
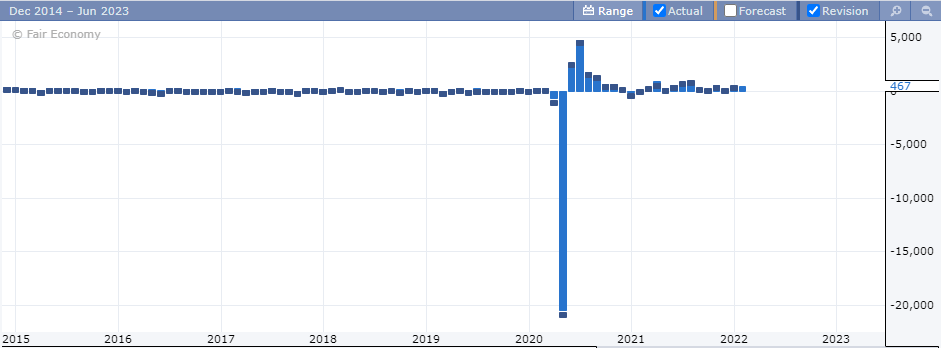
Other instances where the US economy shed jobs include the 2008 – 2009 period due to the global financial crisis.
Depending on how many jobs were added, compared to the previous month, gives a good indication of the US economy. A healthy and growing economy will see a steady increase in the number of jobs being added.
But don’t let this mislead you into concluding that a higher payroll headline print is all that you need. There are other elements to be considered as well.
Unemployment rate
The unemployment rate is another important factor and a key headline number that the markets widely watch.
The jobless rate or the unemployment rate is a month-over-month gauge of the employment level in the United States.
The unemployment rate is important because the Federal Reserve has a dual mandate of maintaining price stability and maximum employment.
Therefore, when there are wide fluctuations in the unemployment rate, it can potentially translate to policy changes from the Fed. This is nothing but tweaks to the monetary policy, which can in turn impact the interest rates.
Historically, the US unemployment rate averages around 4%.
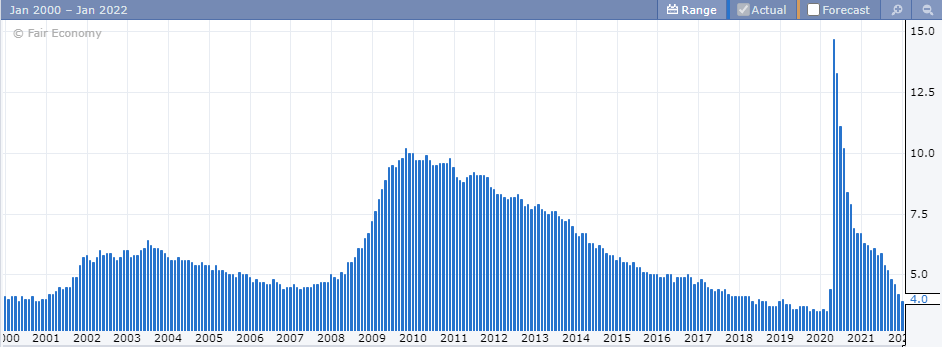
There were two instances when the US unemployment rate shot past 7%. This was during the prolonged period of 2009 through 2014. It was due to the large-scale economic slowdown on the back of the global financial crisis.
The more recent event was during the 2020 Covid-19 crisis where many people (globally) lost their jobs.
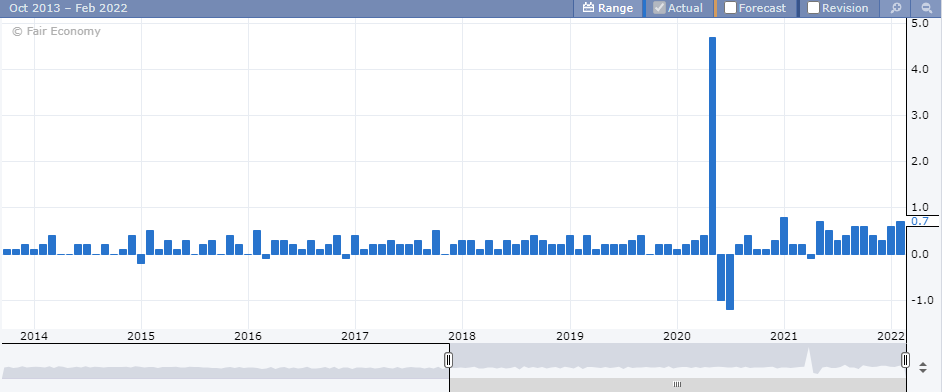
Wage growth
Wage growth is the next key headline number to watch. It measures the level of growth in wages. Wage growth has a direct implication on factors such as consumer spending and inflation. It is also important to consider wage growth in the context of jobs and the unemployment rate.
A falling unemployment rate (which is positive for the markets), alongside a falling wage growth number, can indicate a potential overcapacity in the labour market. This means that as more people find jobs, the wages tend to fall.
On the other hand, a rising unemployment rate, alongside rising wages suggests that there are fewer people in the job market. This scarcity leads to increased wage growth as companies pay more to hire employees.
Wage growth is sometimes referred to as average hourly earnings. It measures the monthly change in the average earnings.
While on the outset a higher wage growth is seen as positive for the markets, it can also hint at underlying problems.
For example, in 2020, wage growth rose to 5%. This wasn’t because of a healthy economy, but because of the scarcity of workers or employees.
The Labor Force participation rate
The labor force participation rate is another important headline number for nonfarm payrolls to look at. However, many traders tend to ignore this.
The labor force participation rate shows how much of the people are leaving the job market (not looking for jobs). The Labor force participation rate is an important indicator as it brings more meaning to the jobs report.
When the labor force participation rate drops, it can incorrectly signal to higher wage growth. This is nothing but the scarcity of workers in the market. As you can see, higher wage growth can be interpreted differently, if you account for the labor force participation rate.
There is a historical trend in the US jobs market, where the labor force participation rate is in a steady downtrend.
Why is the US jobs report important?
The obvious question you may have is why is the US jobs report so important. For the most part, since it is a key economic indicator, investors take notice of this print.
The Federal Reserve also keeps track of this data and there are instances when policy changes were a result of the labor market data.
However, since the report is monthly, it tends to be volatile. Therefore, one should not immediately look at the current report, but rather average out the numbers.
Furthermore, with every new release of the jobs report, one can also expect revisions up to the previous two or three reports. This is because of the reasons mentioned earlier, that the jobs report is a survey that is concluded by the middle of the month.
As participants in the questionnaire often tend to answer with a delay, the revisions also play an important role.
Having said that, the margin of error for revisions to the previous data is not very large. But investors tend to take the net job revisions to gain some perspective.
The jobs report has a direct influence on the Fed’s monetary policy. This, in turn, influences interest rates, and by association, the currency markets.
But as we mentioned, it doesn’t stop just there. The equity markets as well as the bond markets take notice of the payrolls report.
For the equity markets, the jobs report shows the state of health of the US economy and reflects if employers are able to add jobs. For the bond markets, the wage growth and unemployment rate morph themselves into interest rate expectations.
These interest rate expectations tend to move the US dollar.
And since the USD is influenced, it impacts the major currencies, including commodities that are priced in US dollars.
Can you use technical analysis to trade the US payrolls report?
Technical analysis and trading strategies, to trade the US payrolls report are helpful only to a certain extent.
The market initially tends to rise on a positive number. However, once investors digest the rest of the data, the markets may reverse. This volatility can be hard to capture using technical analysis or a trading strategy alone.
Traders need to therefore bring the context to the trading game. You cannot just rely purely on the technical analysis and trading strategy, but also on fundamental analysis as well. In the context of the payrolls report, it is all about interpreting the data and understanding how it will influence the US dollar.
The jobs report is important because it can set or reshape the market trends. Therefore, markets can quickly change their direction, which can be contrary to the initial reaction. It is important that traders who focus on momentum should keep this in mind.
Such a reactionary move can quickly erode the initial profits you made. At the same time, a premature exit can also end up with the trader leaving a lot of money on the table.
This is where the understanding of the jobs report can play a huge role.
What strategies work best to trade the US payrolls report?
As we briefly touched upon this, there are different strategies that one can employ. The time horizon or the holding period can no doubt play a big role.
For the very short term (intraday), momentum-based strategies work best for the forex markets. If you are s medium to the long-term trader, then it takes time for the trend to consolidate itself or to change.
Therefore, there is a higher risk that long-term traders can see their profits erode, especially if the markets reverse direction.
Short-term support and resistance levels and breakout methods can help traders to capture the profits. However, bear in mind that spreads tend to widen closer to the release time. Furthermore, some brokers also do not allow trading around such events.
Traders should therefore first check if their broker who offers forex allows this type of trading. It is more common for a fixed spread broker to disallow news-based trading. Wider spreads can be detrimental to their fixed spread business model.