The crude oil futures curve or the forward curve is one of the most common terms you will hear about. As an oil trader who has exposure to crude oil futures or even CFDs, understanding what the crude oil futures forward curve is all about, is important.
While the forward curve will not be useful to you as a retail trader, it can convey a lot of market information that can be used in some ways when trading oil CFDs.
There are many misconceptions about the forward curve or the futures curve for crude oil. In this article, we will explain in simple terms what the oil futures forward curve is all about.
By the end of this article, hopefully, you will be a bit more knowledgeable when it comes to the crude oil futures curve or the crude oil forward curve.
Many people think that the crude oil futures curve forecasts the future prices of crude oil. This is absolutely wrong!
So let’s get started with the absolute essentials and learn what the oil forward curve is all about.
What is the crude oil futures forward curve?
The crude oil forward curve is simply the term structure of the various oil futures contracts and their respective prices. These oil futures contracts are set up one after the other.
On the left side, you would start with the spot price, which is also known as cash. And then use the immediate or the active oil futures contract to build up the curve.
Therefore, unlike a regular price chart, where you have time on the x-axis and price on the y-axis, a crude oil forward chart has the monthly contracts, also known as the time to maturity (ttm) on the x-axis and their respective price (of each futures contract) on the y-axis.
The forward curve plots the prices of the contracts, starting from spot to 12 months and even longer. The prices for each of these contracts are the daily settlement prices. What this means is that on a day-to-day basis, the forward curve can change.
It is by no means an indication or a forecast of oil prices. The crude oil forward curve plots the prices and shows how the markets are positioned.
How to plot the oil futures forward curve?
The best way to understand what the crude oil forward curves are all about, let’s work with an example and dig our way through.

The first step is to collect the end of the day or the day’s settlement prices starting from the spot oil price, all the way through to the next year.
We will make use of the EOD oil price from Barchart.com.
From this, our table would look like what is shown to the left. It is simply a collection of data comprising the spot price. The most active contract and going all the way through to the end of 2022.
You can of course construct the curve for a longer maturity as well (such as building the forward curve all the way to Dec 2023).
The next step is to use MS Excel to create the futures forward curve for our crude oil data. The result is the below chart as you plot the contracts at their respective prices. As you can see from this little exercise, we simply created a crude oil futures forward curve. From this, we can now form a definition of the crude oil forward curve.
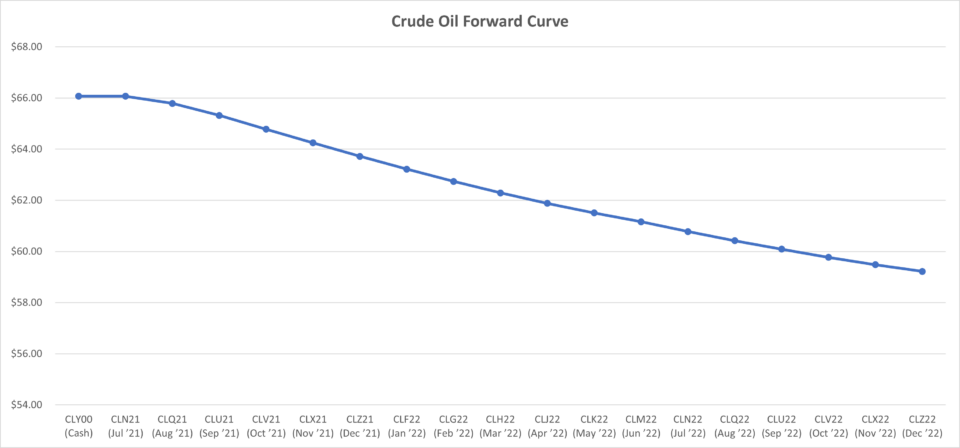
The crude oil futures curve, or the forward curve, is a graph showing the oil prices in the weeks and months to come. In other words, the forward curve is the term structure of the various futures contracts in the crude oil futures chain for a given day.
Thus, when you re-do the same exercise the next day, depending on how prices change, the forward curve may move (up or below) the previous day’s curve.
What is the crude oil futures chain?
The futures chain is what is required to construct the forward curve.
The crude oil futures chain, as the name suggests is a chain of all immediate futures contracts. The futures chain shows the ticker of the futures contracts, their expiry and their prices.
When your club together, the futures contracts in the order (starting from the active contract, all the way into the future), you get the crude oil forward curve.
It is from this futures chain that one is able to plot the futures forward curve. Below is an example oil futures chain from Yahoo Finance. It lists all the contracts, starting from August which is the most active contract and goes into the future.
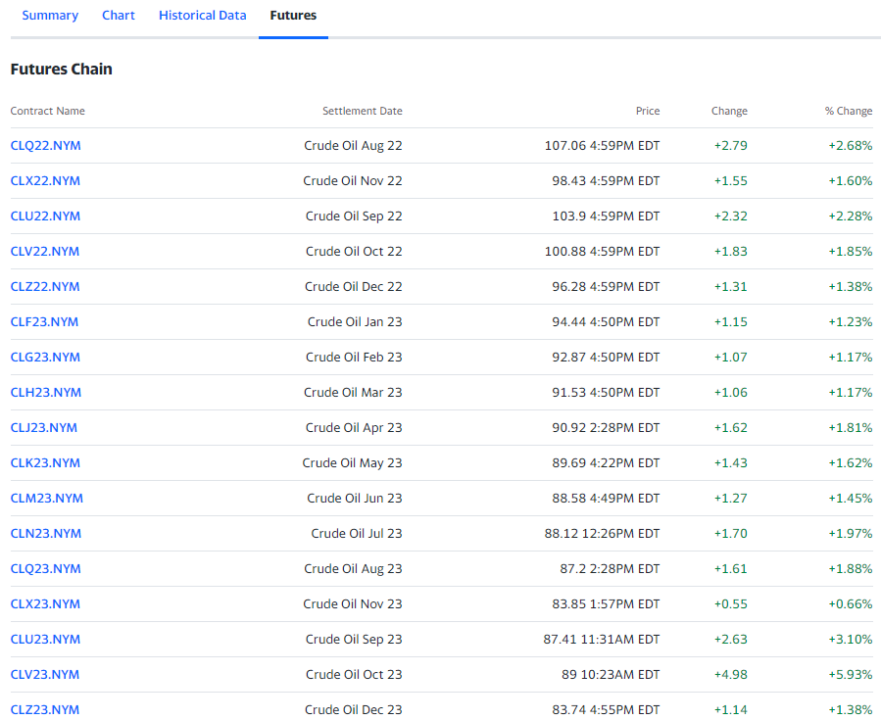
Although the above chart does not show prices, you can get that information as well. From this chain, you can then construct the forward curve. At any given point in time, especially in oil markets, there can be at least ten, if not more active contracts.
There is no hard and fast rule on the number of contracts to have on the forward curve. But it helps to ensure that you only pick out the liquid contracts. This can change depending on the commodity in question.
The oil futures have monthly expiring contracts, whereas, in other markets such as the S&P500 futures, you have quarterly expiring contracts only.
What does the crude oil forward curve tell you?
So far we know what are crude oil futures and also explained with a simple and quick exercise on how to draw your own oil futures forward curve. Now comes the obvious question of what the forward curve tells you.
When you line up all the oil contracts and their respective prices, it tells you what the demand and supply look like for the commodity over a period of time. Meaning that, on a given day, you can determine the worth of crude oil in the future.
Again, it is easy to fall under the illusion that the forward curve can predict prices, but it doesn’t. Looking at the forward curve again, you can know that the price of crude oil in the current day is more expensive than crude oil in the future (x years down the line).
This by extension opens the path to another concept in the futures market, which is the convenience yield.
The convenience yield is a premium or a discount associated with holding the physical goods. In the context of commodities, convenience yields play a big role especially if the delivery comes into question. In the markets, convenience yield is also known as the cost of carry.
Traders should not mix this with carry trade, which is somewhat similar in concept, but not entirely correct.
Using the information from the convenience yield or the cost of carry, traders are able to get a better understanding of the true costs of trading the commodity in question.
However, without going into too further detail, let’s discuss the next step, which is backwardation and contango. These are two terms that you may hear on the news ever so often.
Backwardation and Contango in the futures market
In the previous forward curve, you might notice that the direction of the slope of the curve is to the downside. The current cash market is higher compared to the future price of oil. This is a reflection of the supply and demand in the market.
The technical term for this is called contango and backwardation.
When the futures curve slopes upward, it indicates that there is less demand for oil currently and in the short term, while there is a higher demand for oil in the medium or long term. This creates the upward sloping futures curve. This phenomenon is called backwardation.
Likewise, when the futures curve slopes downward, it indicates that there is high demand for crude oil now, compared to the longer-dated contracts, or in the future. You can see this on the previous chart. This phenomenon is called contango.
Backwardation and contango are two important aspects of the futures forward curve. Whether you are looking at the oil markets or other commodities, the concept remains the same. In short, backwardation and contango are simply terms referring to what the supply and demand look like.
Now if you combine the concepts of cost of carry, professional futures traders can make a decision on whether it is cheaper to “buy and hold” a future contract or whether to “sell the spot or active contract.”
This will enable the trader to get a full picture as well as to derive other concepts. Such as future value and the present value of their commodity futures positions.
What does the forward curve signify?
If the forward curve or the oil price forward curve does not predict price, you might be wondering, what is it used for.
Well, the forward price curve is useful in a lot of ways and this is where things get a bit more advanced. To begin with, the forward curve can show you characteristics such as the cost of delivery, seasonal demands and so on. When the forward curve is in backwardation, it means that demand for the commodity is lower.
On the contrary, when the forward curve is in contango, it shows that demand for the commodity is higher. Using this information traders can potentially build up trading strategies such as calendar spreads.
Calendar spreads are where a trader buys contract #1 and holds a short position in futures contract #2. This way, they are market neutral while benefiting from the market imbalances. Besides this, the cost of carry or storage also plays a role.
Storage is an important concept in the futures markets. You can read more about the cost of storage in this article.
Because of the backwardation and contango phenomena, commercial traders are able to manage their inventory accordingly.
Obviously, when demand for storage is lower, the cost of storage also falls. Thus, as an inventory manager, you might want to take advantage of this lower cost for storage when the market is in contango.
You can bring the futures spread into the equation. Thus, in a contango market, you could ideally stay long on the current contract and also stay short on the next active contract. Because the cost of storage is cheaper, you can wait for both contracts to expire and pocket the difference from the storage.
Besides this simple example, there are many other trading strategies that one could devise using the oil futures curve.
Futures Forward Curve for Oil – Summary
To summarize, the oil forward curve is a curve used in the futures markets. It is simply, a plot of all the futures contracts prices in the oil futures chain. By looking at the futures curve, one can get a brief idea of what the supply and demand for the commodity look like.
Speculators can devise crude oil trading strategies using the forward curve, in the futures market. Similarly, commercial players in the oil futures business can also get an idea of whether it is cheaper to buy crude oil for future delivery or whether to buy it outright.
The forward curve is used for advanced futures trading strategies. It enables traders to hedge their bets within the oil market and not having to look outside or at other commodities. For the average trader, who only has access to the oil CFD’s, the forward curve may not give much meaning.
However, since the commodity forward curve reflects the supply and demand conditions in the market, traders can potentially prepare their trades, depending on other factors. During the current market turbulent times of high inflation and rising interest rates, the forward curve can change dramatically.
One of the best examples of the forward curve was during Covid when there was a surplus of oil, pushing the market into backwardation. While the curve didn’t predict prices, it gave an idea that the global economy was going to slow down.
And in fact, this is what exactly happened during the years 2019 to 2021, when some economies nosedived into recession before recovering.