
Chart of the Week – 19th August 2022
Gold - XAU/USD – US Dollar strengthening Gold struggling to find support.

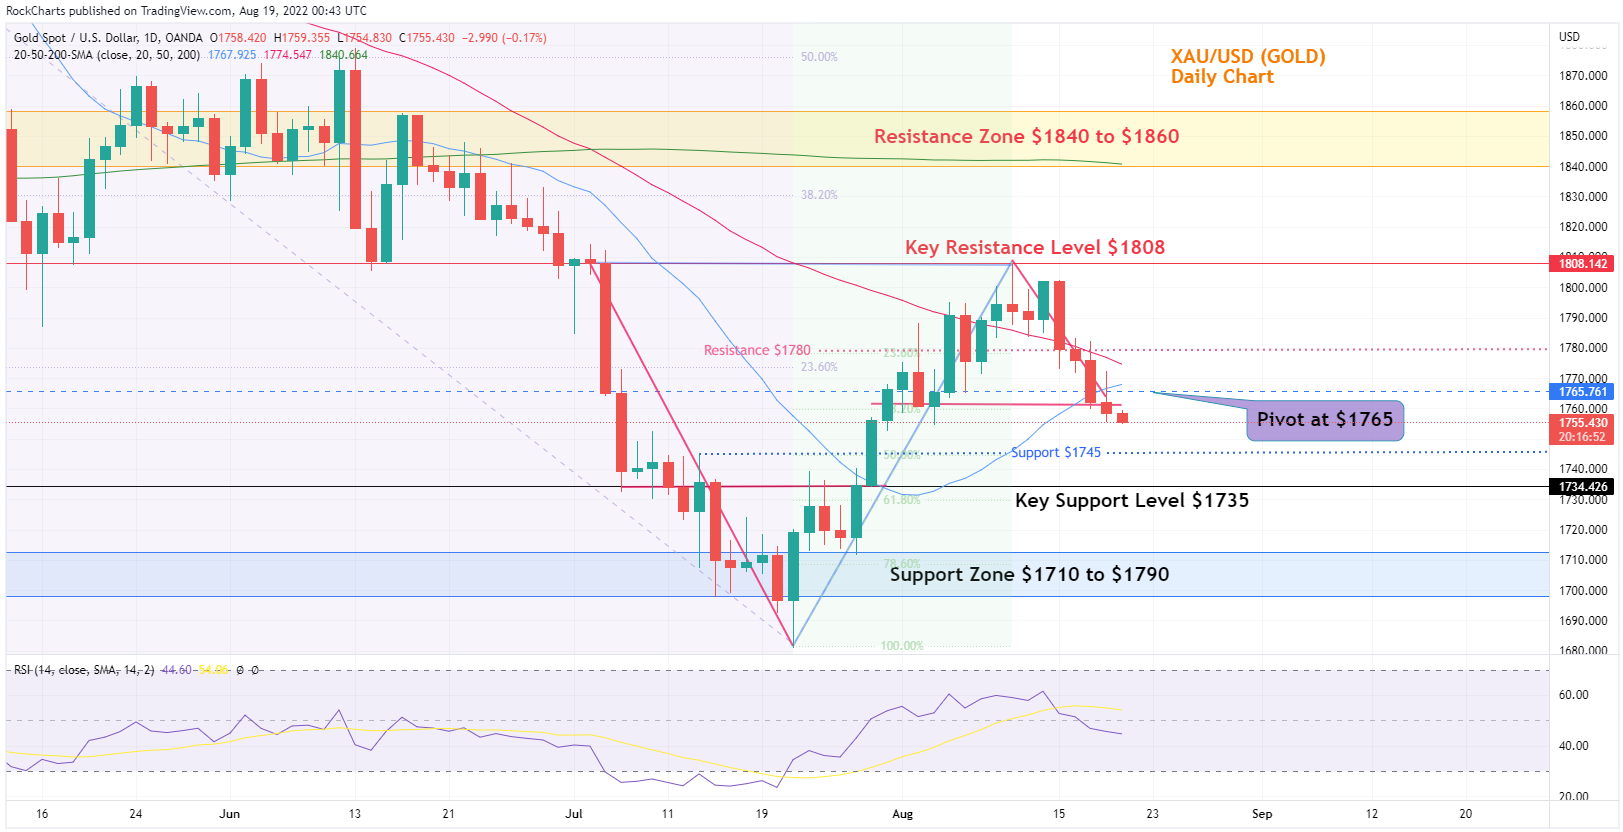
Chart Analysis
The gold chart shows that the prices are heading down towards the key support level at $1735. However, there is soft support available between $1745 also the meeting point of 50% Fibonacci Level. Prices would also be reaching the cross between the 20 Day SMA (Blue Line) and 50 Day SMA (Red Line) on the chart and this could mean that prices can possibly jump at the Cross. This would take the Gold out of the current short-term downtrend path it is heading on. The RSI indicator shows gold prices have dropped below the mid-50-point level and for any recovery to occur the Bulls need to move the prices above the 50 midpoint RSI. The drop in the prices could find support at $1745 or if not then at the Key support level at $1735 also a confluence zone just above the Fibonacci 61.80% level. US dollar has been strengthening and has resumed its upward recovery and re-entered its ascending Channel after a brief fall out. DXY index could find resistance at the 108.00 level.
- Resistance Zone: $1840 to $1860
- Key Resistance Level: $1808
- Major Pivot Point: $1765
- Key Support Level: $1735
- Support Zone: $1710 to $1790
- 200 Day SMA – Green Line
- 50 Day SMA – Red Line
- 20 Day SMA – Blue Line
Daily Chart Directional bias - 2 Weeks
Trade Insights – XAUUSD
The chart shows viable Short Positions under the Pivot point of $1765 or current gold prices. Short positions towards the first target of $1745 Support and if prices do not bounce from $1745 support, then further test of Key Support Level at $1735.
The possible entry of Short Trades below the Pivot at $1765 or the current level
Potential first take profit could be at - $1745
Potential second take profit could be at - $1735
Alternatively, possible Long positions if Gold bounces back from $1745 support also the Fib 50% level on the chart to first test the Major Pivot point at $1765 and then the test of $1780 Resistance and finally the Key Resistance level at $1808.
Possible Entry for Long trades from the Support at $1745 or above the Pivot level at $1765
Potential first take profit could be at - $1765 Pivot
Potential second take profit could be at - $1780 Resistance
Potential third take profit could be at - $1808 Key Resistance Level.