XAU/USD – Sell-off in the US Dollar allowed gold to push higher.

Here are today’s directional views from our market research desk! These can be starting points for your own research to identify opportunities that suit your trading charts and trading style. Like what you see? Feel free to forward this to a friend!

Please note that the analysis presented in the charts below should not be considered investment or trading advice. They are for educational purposes only and you should consider seeking advice from an independent financial advisor.

XAU/USD daily chart
XAU/USD daily chart

Chart Analysis

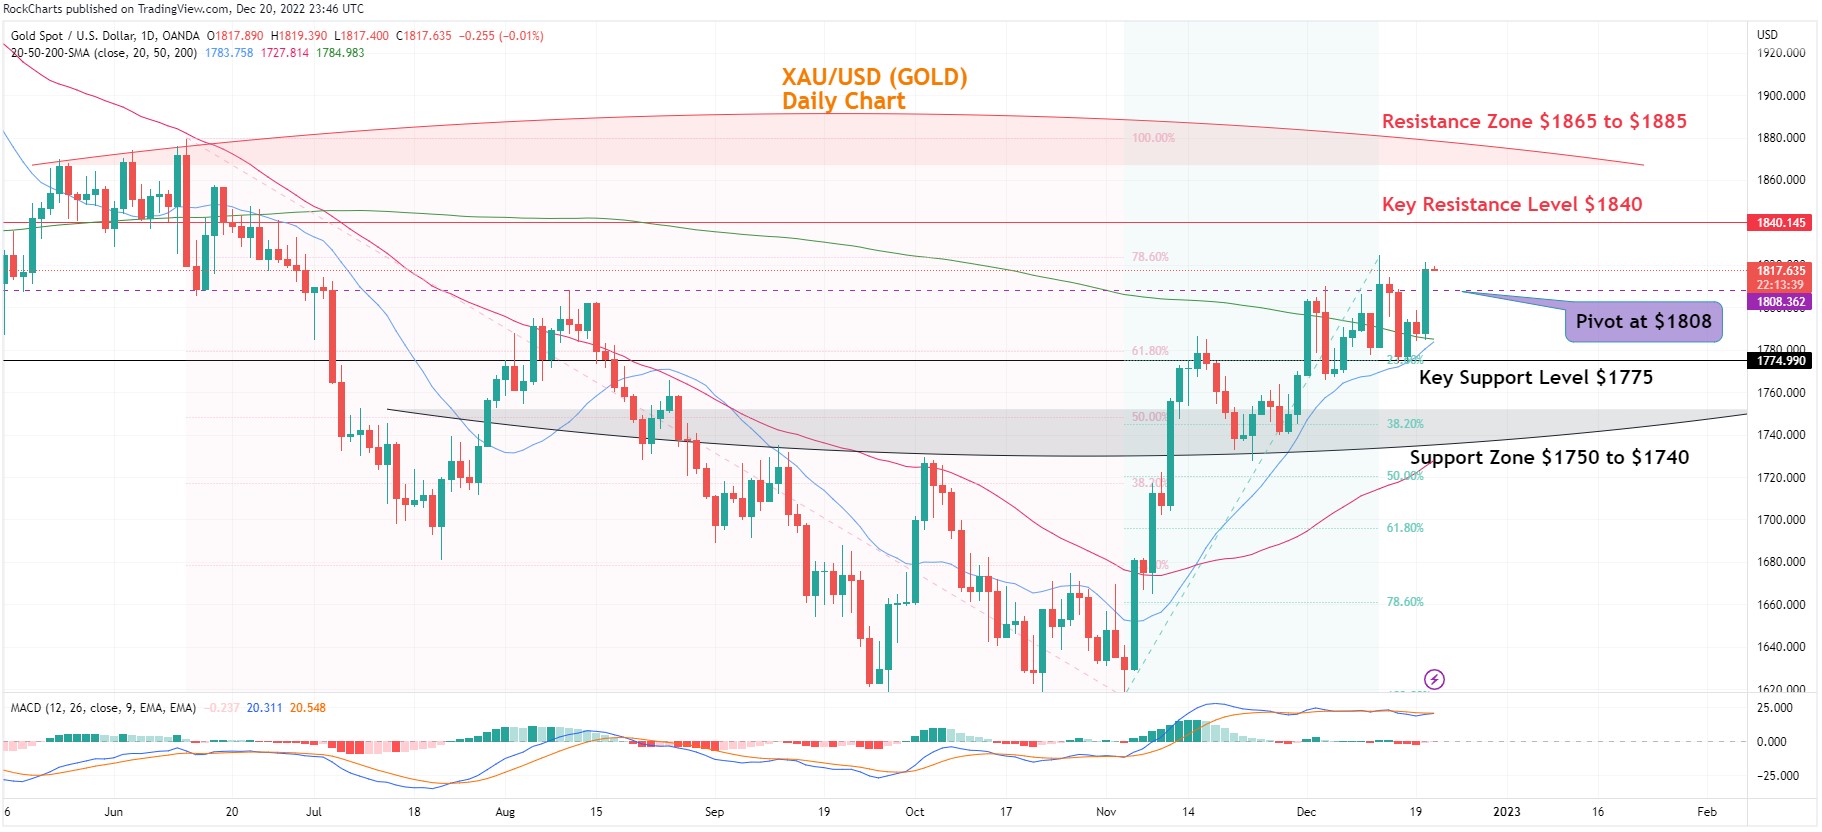
Gold jumped up to $1821 after the US dollar was sold off due to the surprise move from the Bank of Japan to increase the yield curve control targets. However, as the US Bond yields pushed higher on the news the Gold was pressured down a bit. It seems that the ongoing consolidation above the support level at $1775 is over and Gold can witness an upward breakthrough from here.  

The 20-day SMA is rising to provide support to gold prices from the bottom. The 200-day SMA is about to cross with the 20-day SMA line on the chart and this would mean a jump in the gold prices to first test the Key Resistance level at $1840 and then further touch the $1850 resistance zone. This could follow with a retracement of gold prices below the cross-level around $1785 towards the first week of January 2023.

The MACD indicator line is still trading in the overbought zone trying to move above the signal line. As soon as the blue indicator line moves below the orange signal line and starts to part away would signal a Sell off on Gold.

Daily Chart Directional bias - 1 Week 

  • Resistance Zone: $1865 to $1885
  • Key Resistance Level: $1840
  • Major Pivot Point: $1808
  • Key Support Level: $1775
  • Support Zone: $1750 to $1740
  • 200 Day SMA – Green Line
  • 50 Day SMA – Red Line
  • 20 Day SMA – Blue Line

Chart Trading Insights

Trade Insights – XAU/USD

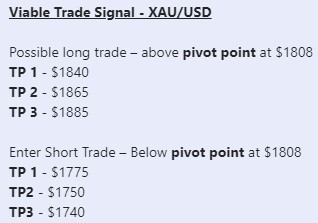
The chart shows viable long positions above the major pivot point at $1808 heading towards the first target of the key resistance level at $1840 and then the test of the key resistance zone between $1865 to $1885.

Alternatively, possible short positions below the major pivot point at $1808 with the target of the key support level at $1775 then the test of the support zone between $1750 to $1740.

Disclaimer: The information provided does not constitute, in any way, a solicitation or inducement to buy or sell securities and similar products. Comments and analysis reflect the views of Rockfort Markets at any given time and are subject to change at any time. Moreover, they cannot constitute a commitment or guarantee on the part of Rockfort Markets. The recipient acknowledges and agrees that by their very nature any investment in a financial instrument is of a random nature and therefore any such investment constitutes a risky investment for which the recipient is solely responsible. It is specified that the past performance of a financial product does not prejudge in any way their future performance. The foreign exchange market and financial derivatives such as futures, CFDs (Contracts for Difference), warrants, turbos or certificates involve a high degree of risk. They require a good level of financial knowledge and experience. Rockfort Markets recommends the consultation of a financial professional who would have a perfect knowledge of the financial and patrimonial situation of the recipient of this message and would be able to verify that the financial products mentioned are adapted to the said situation and the financial objectives pursued. Rockfort Markets recommends reading the “Product Disclosure Statement” section of website for any financial product mentioned.

Any questions? You can call us on 09 281 2012 or email us at info@rockfortmarkets.com any time to help you with your trading requirements.

Rockfort Markets’ products are risky; please read our PDS.

This site is registered on wpml.org as a development site.