
The Commitment of traders report, or CoT report for short is a weekly publication by the U.S Commodities and Futures Trading Association, also known as CFTC. This report shows trading data from the futures and options markets.
In the futures markets, one can trade various currency futures such as the Euro futures, dollar futures, AUD, CAD and other currency futures. According to the CFTC, large financial institutions, including large hedge funds are required to report on their positions for the week. The data is compiled and published every Friday at 1530 Eastern Standard time. It consists of the open positions held up until Tuesday, during the week.
Many argue that the data is irrelevant due to the two-day lag period. However, this is largely a misconception. When it comes to trading huge volumes, it is not as simple as placing a short or a long order with huge volumes. No matter the liquidity, such large orders tend to push prices around.
Hence, such large institutions usually take weeks to offload their positions or to build up their positions. The Commitment of Traders report is therefore a very useful tool when it comes to assessing the markets. It comprises various asset classes ranging from commodities, agriculture, metals and financial futures contracts. It also includes data from the options markets as well.
Learning how to read the commitment of traders' report can be a useful tool for a retail trader, especially if you are swing trading. The report was originally intended for use by the market participants in the futures markets; most importantly the producers and consumers of the commodity who are the active participants.
Of late, speculators and as a result, retail traders have also begun to use the CoT report to understand how the markets are positioned.
The uniqueness of the Futures markets
One might wonder if it makes any sense to use the CoT report for trading spot forex CFD. After all, the futures markets are quite different. This is largely a mistake. There is a strong correlation between the futures and the spot markets. It is widely known that when a futures contract nears expiry it often trades at parity with the spot market.
The spot forex markets as you may know are over-the-counter contracts. Hence, there is no centralized clearing exchange like a stock or a futures exchange. Therefore it is difficult for price discovery and one may not also know about the transactions that take place.
At most, a retail forex trader is only able to view the orders and trading data in terms of volumes within their forex broker universe itself. The futures markets (and options) are traded at an exchange.
Note that some forex options can also be traded over the counter. But when it comes to futures, these contracts have to be traded at an exchange. This allows for more transparency and as a result allows investors and speculators to get an idea of the broader market positioning.
Who reports on the CoT positions?
The next question that comes up is who is required to report on their positions. Firstly, there is a minimum threshold for reporting. According to U.S. law, companies such as large financial institutions and hedge funds alongside other large commercials are required to report on their futures trading activity.
The biggest players are broadly known as large speculators and in trading, circles referred to as "smart money". Large speculators are usually made up of big banks, insurance firms and so on. This category of traders usually sets or go with the trend in the futures markets.
This is followed by commercials which is just another name for businesses that have skin in the game. For example, an airline company can be classified as a commercial if they want to hedge oil prices in the futures markets. Likewise, an orange farmer is also categorized as a commercial since they are in the business of producing oranges for Orange juice futures.
Finally, leveraged funds are made up of asset managers and dealers make up the final lot who report on their futures positions. This final lot is relatively small when it comes to trading volumes, compared to large speculators.
Types of CoT Reports
The CFTC publishes two formats of the CoT report. The legacy reports which is the older version and the Disaggregated CoT report which is relatively new. The CFTC started publishing this report only in September 2009.
While there are no major differences in the numbers, the disaggregated report contains more granularity. In essence, the two categories from the legacy report (commercials and non-commercials and non-reportables) are divided into four groups, namely the commercials, Swap dealers, managed money, and other reportable and non-reportables.
We exclude talking about other non-reportables, since this information is irrelevant to us as traders and is comprised of small speculators.
Firms are required to report their positions if their holdings are above the reporting levels set by the CFTC. The CoT report is further broken down into market types. Futures only and futures and options combined format.
There are also two other reports, namely the supplemental and Traders in financial futures. The supplemental report mostly focuses on some select agricultural commodity contracts, which include both futures and options positions. The Traders in financial futures report is focused on financial contracts ranging from currency futures to US Treasury securities, Eurodollar futures and so on.
The Traders in financial futures is a more recent report that the CFTC started to publish. Given that it focuses on the financial futures markets, which is more relevant for retail traders, it is quite likely that interest in this report will grow over time.
Fundamentally, the TFF follows the same fundamentals when it comes to compiling and publishing the report. Thus, it is not very different from the CoT report. In one way, it removes additional noise such as irrelevant markets. You can read more about the CFTC’s TFF report here.
Where and how to obtain the CoT report?
The CFTC publishes both legacies and disaggregated reports every Friday on its website. It is updated every Friday at 1530 EST. Therefore you can access this website to get the latest weekly data. From here, you can then access the report that you are interested in.
This link for example gives you direct access to the most recent report, covering the financial future. It is published in a report format.
To access historical data, you can visit this link. All of the data is available free of cost by the CFTC.
Example of the CoT Report
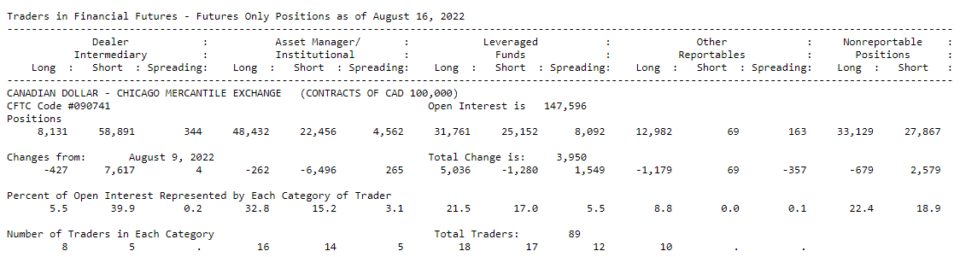
The above table gives an insight into the above link. The picture represents the positioning for the Canadian dollar futures contracts.
The first thing to look at is the "Positions as of" date. This shows the date for which the data is compiled. In the next section, we have five columns, divided based on the reportables, namely the dealers, Asset Managers, and including nonreportable positions.
Below this, you can see the information for the contract and the exchange which it is compiled from. You can also see the breakdown of the contract followed by the CFTC code for that contract. In this example, #090741 is the CFTC code for the CAD dollar from the CME exchange.
Within each of the five categories, it is further broken down into Long, Short and Spreading. The long positions mean the total number of contracts that are long and similarly short.
Spreading is a term that might sound confusing. In essence spreading refers to the amount of offsetting positions held by a trader in different calendar months (and different calendar months if it is a futures and options report combined).
The next row changes from shows the changes in the long, short and spreading from the previous week. A negative number indicates a decline in the respective positions. For example, for the week of August 16, the Dealer Intermediary had a long position of 8,131 contracts. This was a decline from 8,558 long positions from the week before.
Similarly, a positive number in the Changes from indicates an increase from the previous week.
The next row, Percent of Open interest shows the open interest represented as a percentage. Looking at the sample table, you can see that 5.5% of open interest is on the long side, while 39.9% is on the short side for the CAD futures.
Understanding the key components of the CoT report
There are many terms used in the CoT report and within this, retail traders can focus on some key metrics.
Open interest and volume are one of the key aspects to focus on. Open interest measures liquidity in the markets. This is because volatility and price discovery are closely linked to liquidity, which is measured by open interest. In short, open interest is the number of outstanding contracts (which are not closed and can be useful to remember that is it similar to an open position you may have).
Volume merely reflects the total transactions that take place during the period. Open interest usually rises when a trend is developing (both bearish and bullish trends). It helps to understand if more and more large traders continue to maintain an open interest in the direction.
The Net position is of course the easiest of all to understand. It simply shows the net aggregate. Thus, if the market is positioned on the short side, the net aggregate position tends to be negative, and vice versa. Note that there can be a few weeks where despite a negative net position, you may see prices bouncing back higher.
How to interpret the CoT report?
Given the above explanation, the trader needs to put them together in order to get an understanding of what the smart money is doing. This means, not looking at just the most recent report but looking at historical data as well.
Traders typically tend to analyse the current CoT positioning, compared to previous historical data to understand the market direction. This information can be useful for understanding if the market is at an extreme. Usually, an extremely crowded positioning for the previous reporting week tends to see prices snapping back (or making a retracement).
One of the common ways to analyse the CoT report is to look at the net positions for commercials and plot it over a period of time. Depending on the positive or negative movements, this can give a clear idea of the trend.
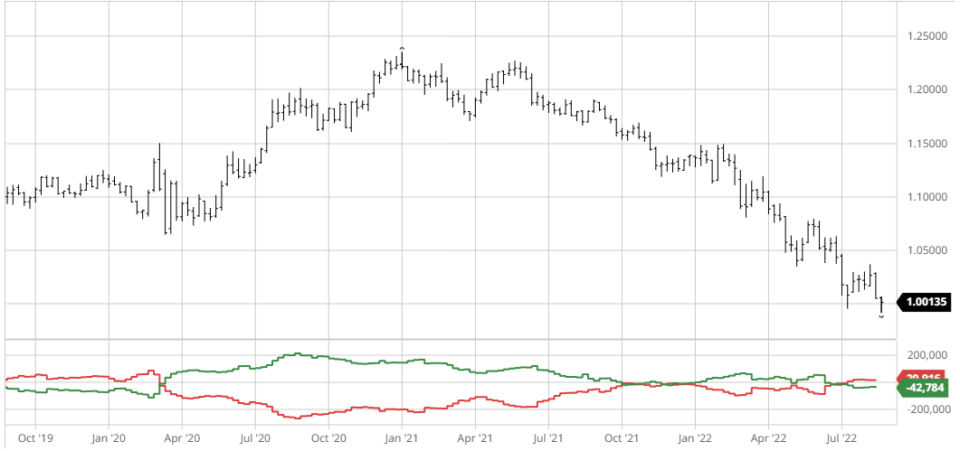
In the above chart, the green line represents the non-commercials, whereas the red line represents the commercials. Both these categories tend to move in the opposite directions to each other. Analysing the net interest allows you to gauge the market trends.
Learning more about the Commitment of Traders report
There are many more methods of analysing the Commitment of Traders report as there are quite a few books published on this. This includes some reputed names as well. Below is a summary of some of the best books to read about the coT report.
Market indicators - The best-kept secret to more effective investing is a book by Richard Sipely. It is an old edition, published in 2009 and covers a wider aspect. But there is a chapter dedicated to the futures markets and in particular the CoT report. Reading this can help you gain a deeper understanding of interpreting the CoT Report.
The Commitments of Traders Bible as the name suggests is one of the most comprehensive books available out there. It was published in 2008 and has an in-depth coverage of the CoT report, as well as some strategies that you can use.
Larry William's Secrets of the CoT report is another big title worth reading. This book however focuses more on the commodity futures markets. Yet, it gives you an insight into how Williams' interprets the CoT charts.
Finally, the Commitments of Traders - Strategies for tracking the market and trading profitably by Floyd Upperman is another book that covers the CoT report and its intricacies. The above set of books will give the reader very good insights into how to read into the futures markets and more importantly interpret the data.
In conclusion, the Commitment of Traders report is a great tool that traders can use to enhance their trading bias. It does not give an edge but it can greatly raise your confidence in trading. At best, it will put you on the right side of the markets.
However, we should mention that using the CoT report will not entirely eliminate the risk, which is down to the trader on how they manage their positions.
