XAU/USD – Gold dropped from the Key Resistance Level.

Here are today’s directional views from our market research desk! These can be starting points for your own research to identify opportunities that suit your trading charts and trading style. Like what you see? Feel free to forward this to a friend!

Please note that the analysis presented in the charts below should not be considered investment or trading advice. They are for educational purposes only and you should consider seeking advice from an independent financial advisor.

XAU/USD – Gold dropped form the Key Resistance Level.
XAU/USD – Gold dropped from the Key Resistance Level.

Chart Analysis

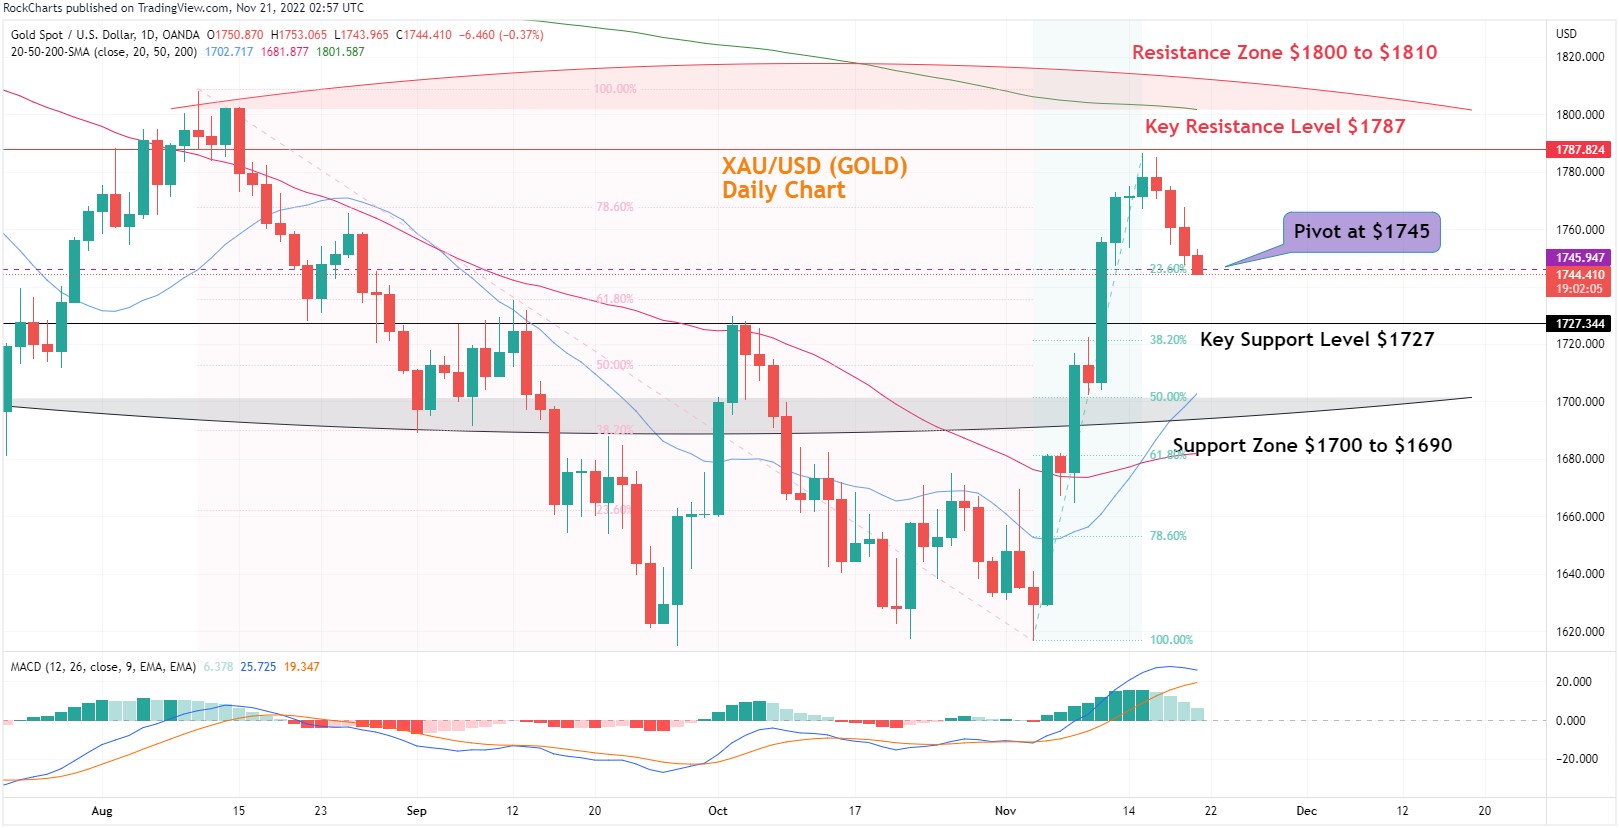
The gold chart shows that the pair has dropped from the previous Major Pivot at $1767 and is not trading just under the current Major Pivot at $1745 and the 23.60 Fibonacci level. The next support is around $1736 and there is the Key Support Level at $1727. After the 20-day SMA crossed over the 50-day SMA that confirmed the overbought zone for gold to investors and this prompted them to start selling out of Gold. The sell-off has been slow as buyers have been holding the sell-off quite well. The MACD signals are also now taking a downward turn from the overbought zone and could cross below the signal orange line.

Please check the Chart Trading Insights below

  • Resistance Zone: $1800 to $1810
  • Key Resistance Level: $1787
  • Major Pivot Point: $1745
  • Key Support Level: $1727
  • Support Zone: $1700 to $1690
  • 200 Day SMA – Green Line
  • 50 Day SMA – Red Line
  • 20 Day SMA – Blue Line

Daily Chart Directional bias - 1 Week 

Trade Insights – XAU/USD

The chart shows viable long positions above the major pivot point at $1745 heading towards the first target of the key resistance level at $1787 and then testing of key resistance zone between $1800 to $1810.

The possible entry of long above below the major pivot at $1745.

Potential first-take profit could be at – $1787

Potential second take profit could be at – $1800 to 1810.

Alternatively, possible short positions below the major pivot point at $1745 with the target to test the key support level at $1727 and then the test of the support zone between $1700 to $1690.

Possible entry for short trades below the major pivot point at $1745.

Potential first-take profit could be at – $1772

Potential second-take profit could be at – $1700

Potential third-take profit could be at – $1690.

Disclaimer: The information provided does not constitute, in any way, a solicitation or inducement to buy or sell securities and similar products. Comments and analysis reflect the views of Rockfort Markets at any given time and are subject to change at any time. Moreover, they cannot constitute a commitment or guarantee on the part of Rockfort Markets. The recipient acknowledges and agrees that by their very nature any investment in a financial instrument is of a random nature and therefore any such investment constitutes a risky investment for which the recipient is solely responsible. It is specified that the past performance of a financial product does not prejudge in any way their future performance. The foreign exchange market and financial derivatives such as futures, CFDs (Contracts for Difference), warrants, turbos or certificates involve a high degree of risk. They require a good level of financial knowledge and experience. Rockfort Markets recommends the consultation of a financial professional who would have a perfect knowledge of the financial and patrimonial situation of the recipient of this message and would be able to verify that the financial products mentioned are adapted to the said situation and the financial objectives pursued. Rockfort Markets recommends reading the “Product Disclosure Statement” section of website for any financial product mentioned.

Any questions? You can call us on 09 281 2012 or email us at info@rockfortmarkets.com any time to help you with your trading requirements.

Rockfort Markets’ products are risky; please read our PDS.

This site is registered on wpml.org as a development site.