XAU/USD – Gold jumped up by 2.38% to $1870 on falling bond yields.

Here are today’s directional views from our market research desk! These can be starting points for your own research to identify opportunities that suit your trading charts and trading style. Like what you see? Feel free to forward this to a friend!

Please note that the analysis presented in the charts below should not be considered investment or trading advice. They are for educational purposes only and you should consider seeking advice from an independent financial advisor.

XAU/USD daily chart
XAU/USD daily chart

XAU/USD daily chart

Chart Analysis:  

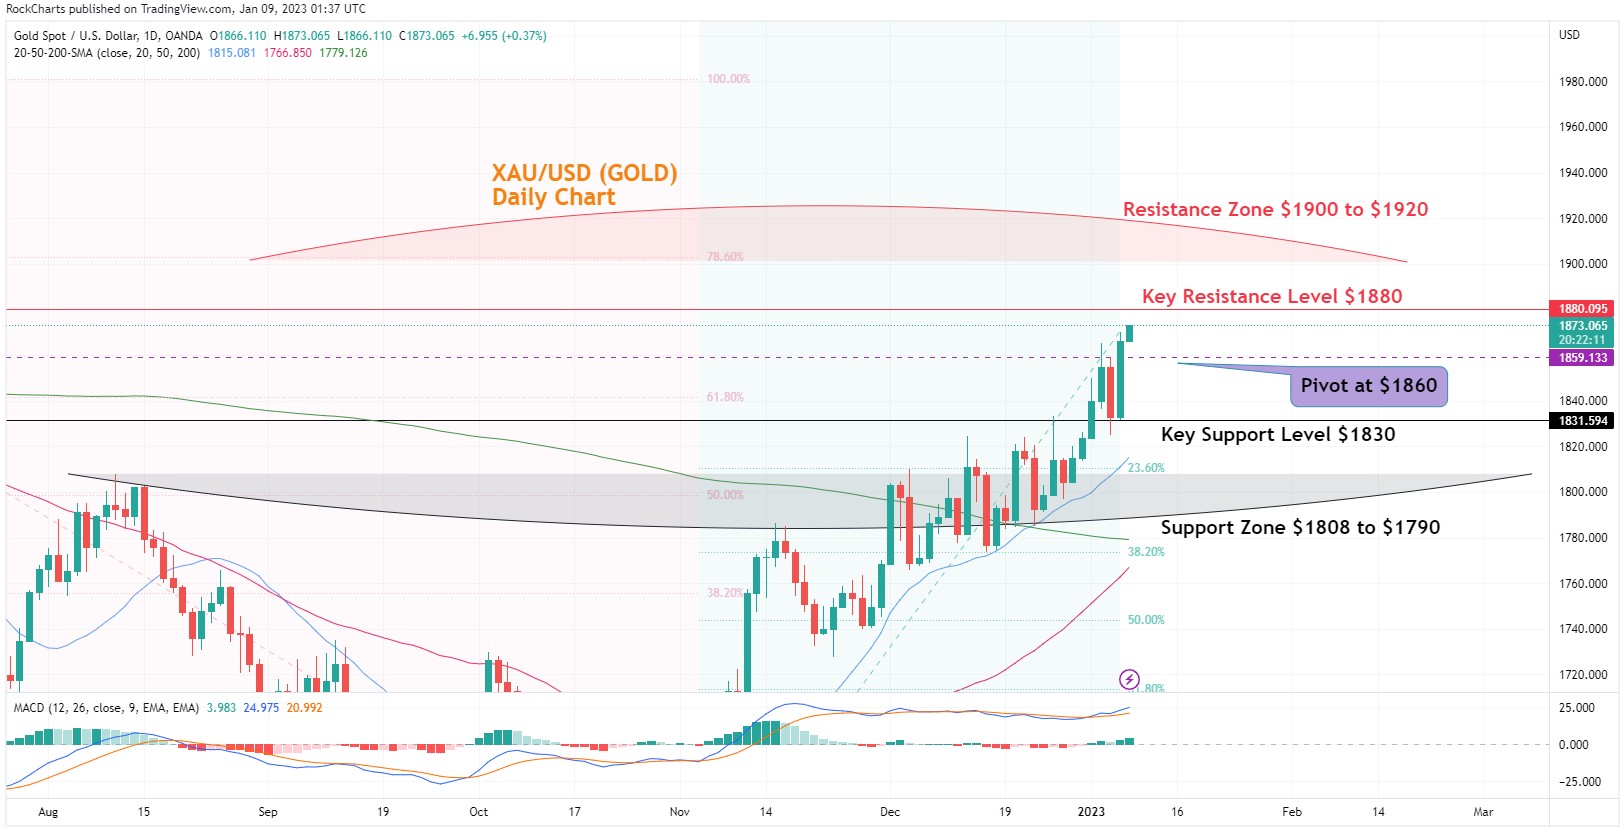
Gold jumped back up to 1870, its multi-month high after the US 10-year treasury fell by 15bps to 3.6% on Friday, the lowest in three weeks. The factor behind the enthusiasm amongst the investors was US wage growth that unexpectedly slowed in December and earnings for previous months were revised sharply lower. This scrambled the gold investors to push the prices back up above $1870 from $1832.

The gold chart shows that the pair jumped up by $34 on Friday and is now already about to test the Key resistance level on the chart at $1880 depicting the next upside break in the gold prices. The 20-day SMA crossed the 50-day SMA earlier on 22nd December and we indicated that the costs would jump higher from this point on no the pair is already testing the updated Key resistance level on the chart at $1880. There could be a drop in the gold prices from under that Resistance zone to complete the whole cycle of the SMA Cross signal sooner or later.  The MACD indicator is comfortably moving higher in the overbought zone and any correction from here could be sharper.

Daily Chart Directional bias - 1 Week 

  • Resistance Zone: $1900 to $1920
  • Key Resistance Level: $1880
  • Major Pivot Point: $1860
  • Key Support Level: $1830
  • Support Zone: $1808 to $1790
  • 200 Day SMA – Green Line
  • 50 Day SMA – Red Line
  • 20 Day SMA – Blue Line

Chart Trading Insights

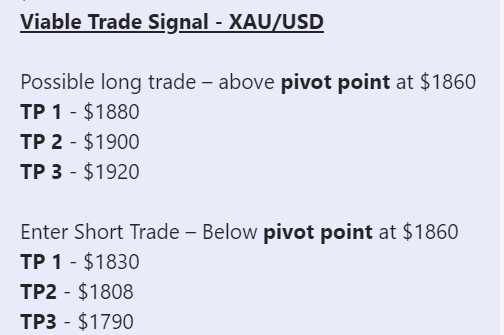
Trade Insights – XAU/USD

The Chart shows viable long positions above the major pivot point at $1860 heading towards the first target of the key resistance level at $1880 and then the test of the key resistance zone between $1900 to $1920.

Alternatively, possible short positions below the major pivot point at $1860 with the target of the key support level at $1830 then the test of the support zone between $1808 to $1790.

Disclaimer: The information provided does not constitute, in any way, a solicitation or inducement to buy or sell securities and similar products. Comments and analysis reflect the views of Rockfort Markets at any given time and are subject to change at any time. Moreover, they cannot constitute a commitment or guarantee on the part of Rockfort Markets. The recipient acknowledges and agrees that by their very nature any investment in a financial instrument is of a random nature and therefore any such investment constitutes a risky investment for which the recipient is solely responsible. It is specified that the past performance of a financial product does not prejudge in any way their future performance. The foreign exchange market and financial derivatives such as futures, CFDs (Contracts for Difference), warrants, turbos or certificates involve a high degree of risk. They require a good level of financial knowledge and experience. Rockfort Markets recommends the consultation of a financial professional who would have a perfect knowledge of the financial and patrimonial situation of the recipient of this message and would be able to verify that the financial products mentioned are adapted to the said situation and the financial objectives pursued. Rockfort Markets recommends reading the “Product Disclosure Statement” section of website for any financial product mentioned.

Any questions? You can call us on 09 281 2012 or email us at info@rockfortmarkets.com any time to help you with your trading requirements.

Rockfort Markets’ products are risky; please read our PDS.

This site is registered on wpml.org as a development site.