
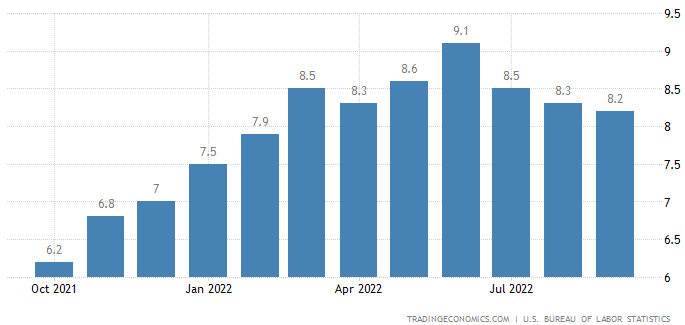
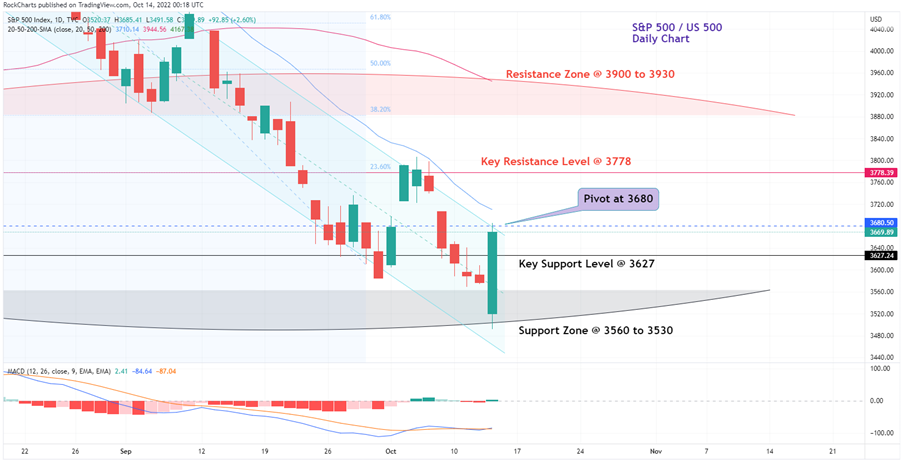
S&P 500 Jumped up by 2.60% yesterday, Dow Jones surged by 2.83% or 1500 points and the Nasdaq composite gained 2.23% in a historic one-day turnaround as the Inflation rate in the US slowed for the third month to 8.2% in September 2022. This is the lowest reading in the past seven months at 8.2% compared to 8.3% in 8.3% in August. The market saw a choppy session yesterday where the stocks fell to their lowest levels since 2020 to touch 3494 points and then posted a stunning rebound.
Gold - XAU/USD – Gold price is very Volatile as Inflation data leaves the market in confusion initially and later rebounds sharply to erase all losses.

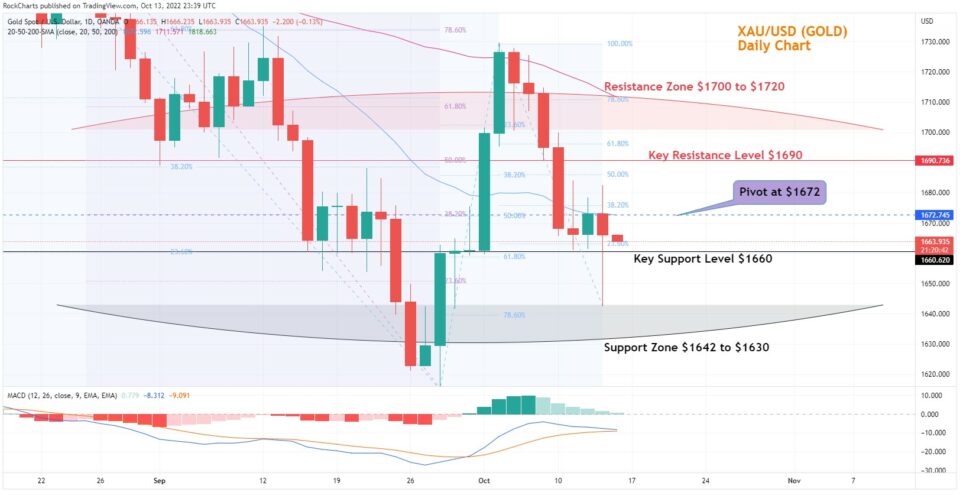
Chart Analysis:
Gold bounced back up from $1643 a new recent low after yesterday's US inflation news. Gold dropped after touching the 20-Day SMA and is not sliding back to testing the Key Support Level at $1660. The MACD indicator is reaching a cross between the indicator line and a signal line showing there could be a weakness in gold prices in the coming week. Prices are far below the 50 Day EMA and 200 Dam EMA indicators which shows the investors are unsure and Gold is probably looking for an inflection point.
Please check the Chart Trading Insights below
- Resistance Zone: $1700 to $1720
- Key Resistance Level: $1690
- Major Pivot Point: $1672
- Key Support Level: $1660
- Support Zone: $1642 to $1630
- 200 Day SMA – Green Line
- 50 Day SMA – Red Line
- 20 Day SMA – Blue Line
Daily Chart Directional bias - 2 Weeks
Trade Insights
XAUUSD – Chart shows viable Short Positions below the Key Support Level at $1660 heading towards the first target of Support Zone at $1642 further test of the Support at $1630.
Possible entry of Short Trades below the Key Support at $1660.
Potential First take profit could be at - $1642
Potential Second take profit could be at - $1630
Alternatively, possible Long positions if Gold stays above the Key Support Level at $1660 with the target to test the Major Pivot at $1672 and then the test of the Key Resistance Level at $1690.
Possible Entry for Long trades if Gold stays above the Key support at $1660
Potential First take profit could be at - $1672
Potential Second take profit could be at - $1690
Potential Third take profit could be at - $1700