XAU/USD – Gold surged prompted by the falling dollar and weaker inflation.

Here are today’s directional views from our market research desk! These can be starting points for your own research to identify opportunities that suit your trading charts and trading style. Like what you see? Feel free to forward this to a friend!

Please note that the analysis presented in the charts below should not be considered investment or trading advice. They are for educational purposes only and you should consider seeking advice from an independent financial advisor.

XAU/USD daily chart
XAU/USD daily chart

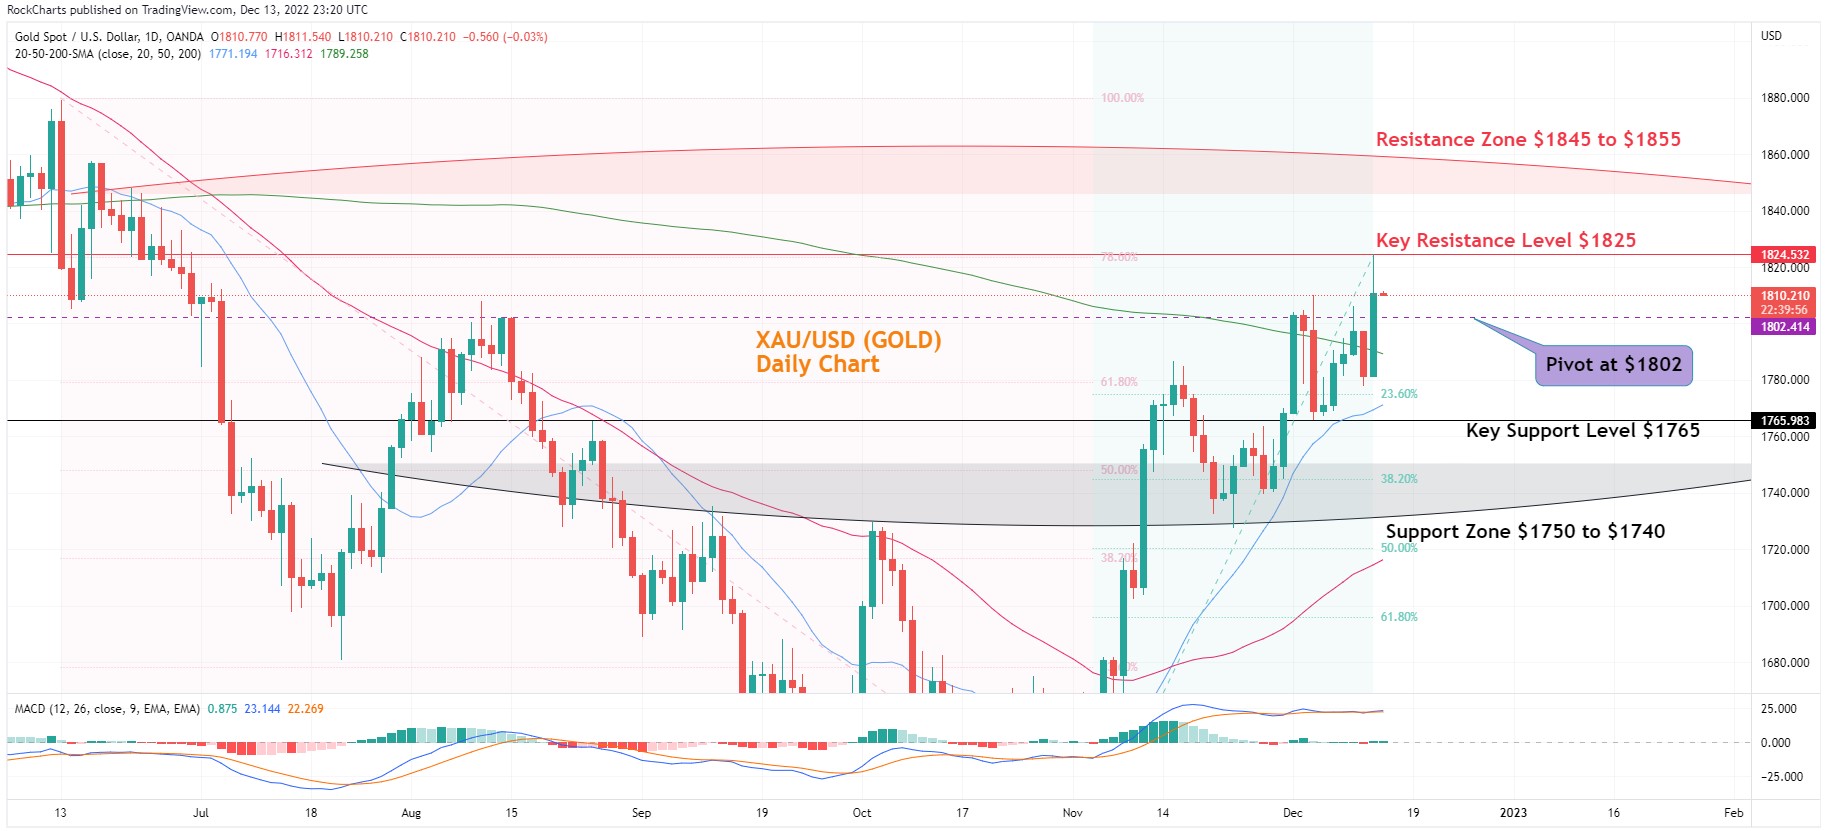
Chart Analysis:  Gold jumped up yesterday by 1.63% to touch $1824 then later dropped down to settle at $1810 and making a fresh 5-month high and creating a high wick candle on the chart.  Apparently, the tide has turned in the bull's favour and Gold has now recovered by almost 45% of the 2022 Sell-off.

The gold chart shows that the pair jumped up by $28 or 1.64% yesterday and now already testing the July month's peak before the Gold dropped sharply on 5th July due to the high inflation print. The jump was pushed by the dropping dollar from 105 to under 104. The pair is not making higher highs and lower lows moving to test the longer-term resistances on the chart.

The 20-day SMA is rising to catch up with the prices and is followed by the 50-day SMA. The 200 Day SMA has also dropped below the prices indicating a full bullish bias of the markets. The MACD indicator line is still trading in the overbought zone staying above the signal line. As soon as the blue indicator line moves below the orange signal line and starts to part away would signal a Sell off on Gold.

Daily Chart Directional bias - 1 Week 

  • Resistance Zone: $1845 to $1855
  • Key Resistance Level: $1825
  • Major Pivot Point: $1802
  • Key Support Level: $1765
  • Support Zone: $1750 to $1740
  • 200 Day SMA – Green Line
  • 50 Day SMA – Red Line
  • 20 Day SMA – Blue Line

Chart Trading Insights

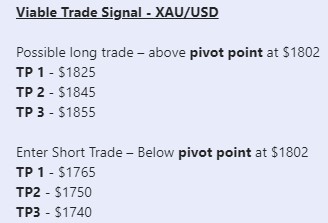
Trade Insights – XAU/USD

The chart shows viable long positions above the major pivot point at $1802 heading towards the first target of the key resistance level at $1825 and then the test of the key resistance zone between $1845 to $1855

Alternatively, possible short positions below the major pivot point at $1802 with the target of the key support level at $1765 then the test of the support zone between $1750 to $1740.

Disclaimer: The information provided does not constitute, in any way, a solicitation or inducement to buy or sell securities and similar products. Comments and analysis reflect the views of Rockfort Markets at any given time and are subject to change at any time. Moreover, they cannot constitute a commitment or guarantee on the part of Rockfort Markets. The recipient acknowledges and agrees that by their very nature any investment in a financial instrument is of a random nature and therefore any such investment constitutes a risky investment for which the recipient is solely responsible. It is specified that the past performance of a financial product does not prejudge in any way their future performance. The foreign exchange market and financial derivatives such as futures, CFDs (Contracts for Difference), warrants, turbos or certificates involve a high degree of risk. They require a good level of financial knowledge and experience. Rockfort Markets recommends the consultation of a financial professional who would have a perfect knowledge of the financial and patrimonial situation of the recipient of this message and would be able to verify that the financial products mentioned are adapted to the said situation and the financial objectives pursued. Rockfort Markets recommends reading the “Product Disclosure Statement” section of website for any financial product mentioned.

Any questions? You can call us on 09 281 2012 or email us at info@rockfortmarkets.com any time to help you with your trading requirements.

Rockfort Markets’ products are risky; please read our PDS.

This site is registered on wpml.org as a development site.