USD/JPY
- Resistance Cluster: 117.40
- Key Resistance: 116.05 to 116.30
- Major Pivot Point: 114.60
- Key Support Level: 113.55
- Support Zone: 112.20 to 112.00
- Last Analysis Date: Blue Vertical Line
- 200 Day EMA – Green Line
- 50 Day EMA – Red Line
- CBOE VIX – Volatility Index @ 35.13 -1.32 (-3.62%)
Trade Insights – USD/JPY Forex pair – Chart shows viable short positions below the Key Resistance level of 116.05 to 116.30. With the first target of the Pivot Point at 114.60, it then hit the Key support level at 113.55. Finally, it heads towards Support Zone between 112.20 to 112.00. (Source from tradingview)
Alternatively, Long positions above the 116.05 Key Resistance level of 110.60 with the target of Support Zone between 109.60 t0 109.30.
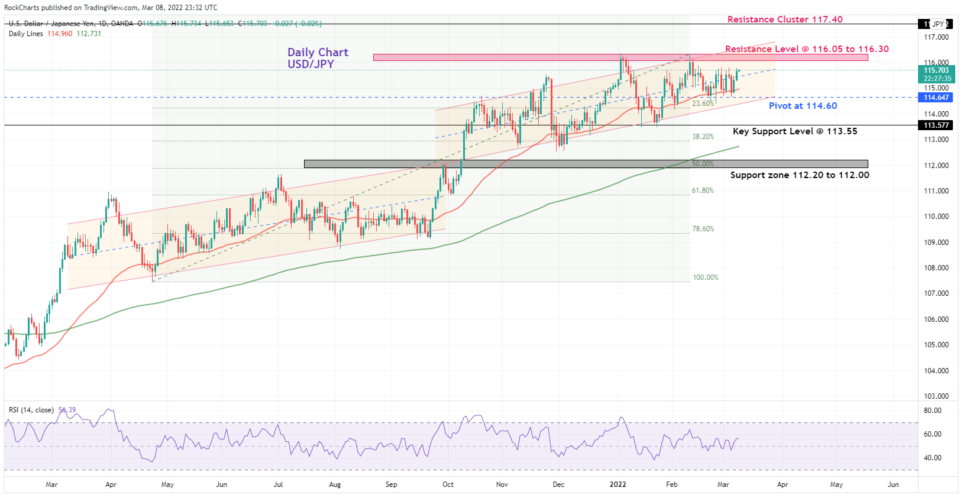
Chart Analysis:
Directional bias: 2 Weeks USD/JPY
USD/JPY chart shows that prices climbed up from the previous upward parallel channel to the form altogether a new parallel channel a rare occurrence. USD/JPY pair is heading towards the January High of 116.40. And it moves above the upper limit of the parallel channel. The resistance could prove to be stronger to break through to form a new 2022 high. And ifs did then the next Resistance Cluster is at 117.40 level.
The RSI indicator shows the prices at 60 points, and this means there is room for more upside for the pair. Prices are trading quite above the 50 Day EMA and 200 Day EMA showing bullish sentiments of the market and a steady upward movement of the Average indicators. Any drop below the Pivot on the chart at 114.60 could mean the prices then can also drop out of the parallel channel to hit the 38.20% Fibonacci level and then the support zone at 112.20 to 112. you can learn how to read charts here.
Fundamental Overview: Japan reported a GDP of 4.6% just missing the 5.6% forecast by Bloomberg for the economy. However, there is going to be a rough ride for the whole global economy ahead due to the surging oil, commodity prices, geopolitical risks, and ever-increasing potential of sell-off and Bear Market.