Andrews Pitchfork, commonly called the 'Median Line', is a technical trading tool employed by forex traders.
You can utilize this not just on the forex markets, but also in any financial markets where you apply any sort of technical analysis.
Unlike most technical indicators, such as the moving averages or the MACD and similar indicators, Andrews Pitchfork is somewhat different.
This falls under the category of a technical drawing tool. And since this is a tool anyone can use, there is a lot of subjectivity involved. There are many books and online courses that claim to teach you how to draw Andrews Pitchfork the right way.
However, the best way to learn using median lines is to practice. Initially, your analysis may be off, but over time you can train your eye to spot the right points.
With the right experience at hand, the Andrews pitchfork tool can be a great complementary tool to your technical analysis.
You can use the median line tool in your existing strategy or use it as a leading indicator and combine it with other technical indicators.
The Andrews’ pitchfork tool is a leading indicator. Because it potentially forecasts what or how prices can move. Thus, when traders combine this trend or volatility indicators, it can be a great combination to trade with.
One of the key things that traders should have before they use the median line tool is a good understanding of price action. You don’t need to be an expert. However, the basic requirements are that you are able to identify trends, without using any indicators. You should also be able to spot swing points in the price action itself.
Remember that the pitchfork tool only estimates what prices may do. It does not guarantee what the price will do.
History of the Andrews Pitchfork tool
The Andrews Pitchfork tool gets its name from the fact that the technical drawing indicator looks like a pitchfork. The name Andrews is attributed to its creator, Dr. Alan Andrews. Although the concept of median lines existed long before his, Andrews was the one who applied its use to the technical analysis of the financial markets.
The concept of using the pitchfork tool became famous in his works, the Action-reaction course. Andrews started teaching the concepts of this, which gave rise to many successful traders. One of these was Roger Babson, a student of Andrews. Babson continued the work of Andrews and his name is also commonly used in the context of median line trading.
You can find the biography of Roger Babson here.
One of the key concepts of the median line and taken from the Action Reaction course is Newton’s 3rd law of motion.
Newton's third law states that “For every action, there is an equal and opposite reaction.”
Some also refer to the median line as the action-reaction line. You will soon learn in the later parts of this article the relevance of action/reaction.
What is the Andrews pitchfork tool? And what does it do?
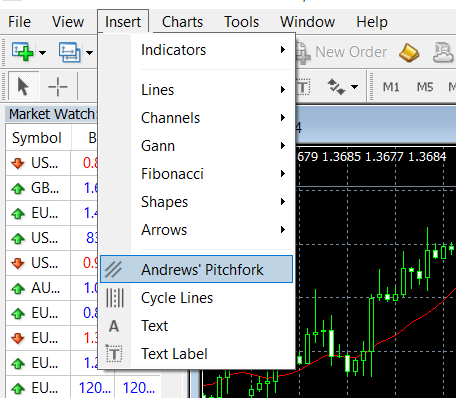
The Andrews Pitchfork tool is now one of the many default technical drawing tools. You can find this drawing tool in just about any charting platform, including the MT4.
The MT4 icon for the median line is the pitchfork.
Broadly speaking, the median line tool is used to predict a continuation of the previous trend. Depending on one’s expertise, it can also be used to predict a trend reversal or a correction in the markets. Despite the fancy lines, at its core, the median line tool is used to predict support and resistance levels, as well as the areas.
The median line tool does not work all the time. But when it does, it can validate the turning points in prices.
Andrews median line chart
The first chart below shows the median line tool.

Here, you can see how after plotting the median line tool, price tends to respect these lines.
As the downtrend continues, prices bounce off the upper and the lower bounds of the pitchfork tool. The median line is the middle line which sees a lot of interaction with prices.
As you can notice from the above picture, the median line requires certain key reference points before you can begin to plot it. You will also notice the way the pitchfork was plotted, which we will cover in the next section.
Overall, the goal of the pitchfork tool is to potentially predict if the price will continue in the same direction, i.e: trend or if it would change.
This can be seen when there is a deviation in price from the pitchfork tool.
How to plot the median lines using the pitchfork tool?
To plot the median lines, we first need to have three points of reference, which can be reversed depending on the trend.
In an uptrend, the three reference points will be a:
- Swing low
- Then a swing high
- Finally a swing low.
The second swing low must be a higher low than the first. Otherwise, the pitchfork tool won’t hold.
Conversely, in an downtrend, to plot the median line, you need a
- Swing high,
- Then a swing low,
- Finally a swing high.
Once again, the second swing high must be a lower high than the first.
The general idea is to connect these three points.
In most charting tools, you may find that there are additional outer lines. You do not need these unless you are a pro at trading with median lines.
Once the median line is constructed, you are able to see how the three lines shape out to be.
In the downtrend, they will be facing downward of course. And in an uptrend, the median line will face upward. A change of trend or reversal is seen when the prices break out from the median line’s boundaries.
Andrews Median Line in an uptrend
Below is an example of a median line in an uptrend.
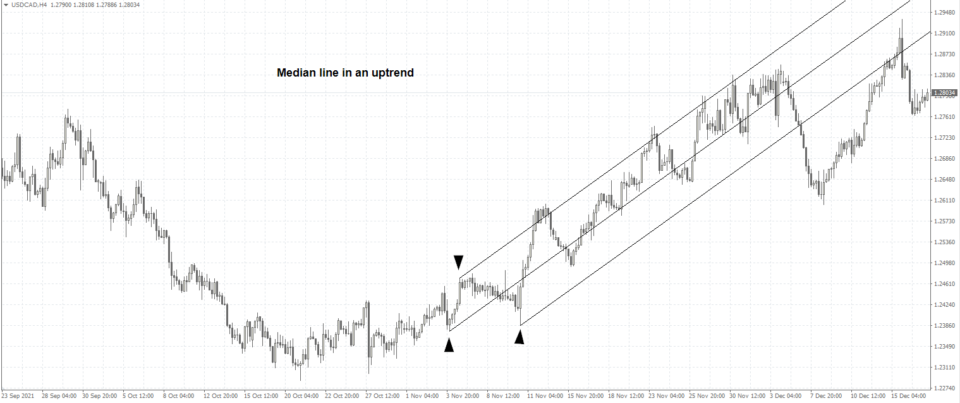
In the above chart, we have the median line example for an uptrend.
We start with the
- Swing low,
- Then move to the swing high
- Finally, another swing low.
Notice the last swing low is a higher low than the first.
Overall, to train your eye, just look for the following format.
Drawing Median Lines

Once you begin to identify this pattern, plotting the median lines become very easy.
The next step after this is to merely fine tune the reference points. This is one of the important things that many online references leave out.
Fine tuning your median lines
If you research online about median lines, you will always hear about using swing high and low points.
However, this is not the case. Once you plot the median line using the reference points, you still need to adjust them.
Let’s take a look at an example. In the chart below, we have a median line that blindly follows the concept of using a swing high, low and high points.
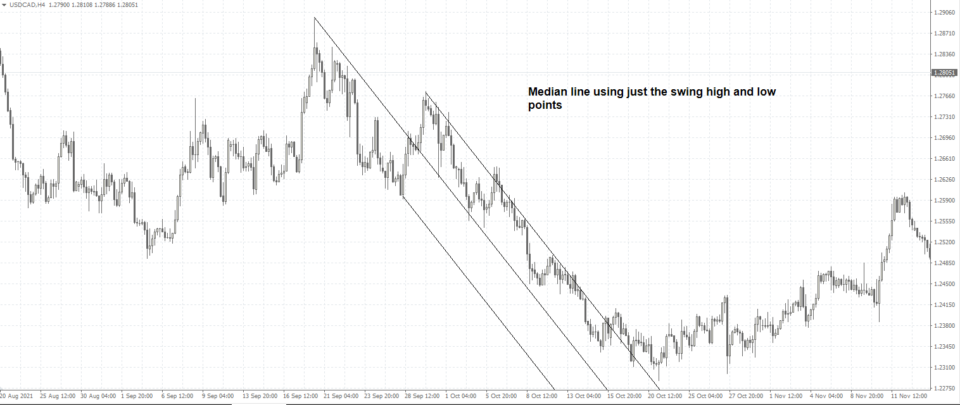
Indeed, what you see here is price respecting the median line but only up to a certain point.
If you observe the chart closely, you will find that there are instances when price breaks out from the median line.
This could trick you into believing that prices are revering. But as you see, the subsequent candlesticks continue to trend lower.
Let’s now take this same chart but adjust the Andrews median lines.
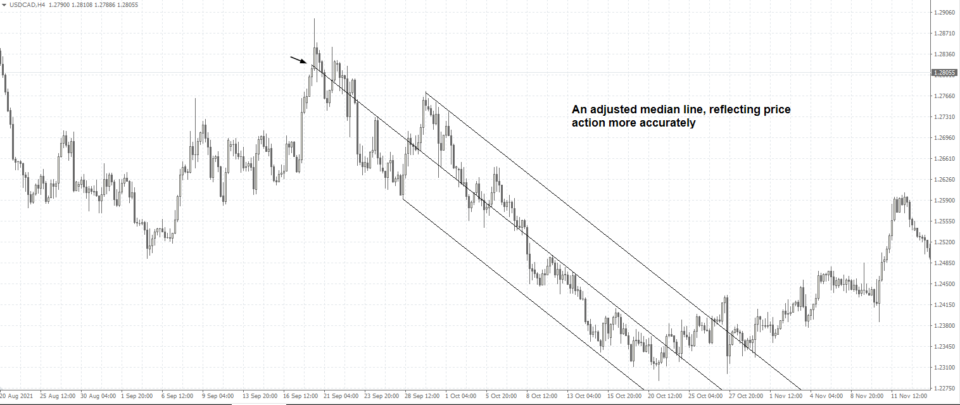
In this second chart, notice how we adjusted the median line. This is done by simply moving the swing high to a reference point such that the price action fits in.
If you compare the above two charts, it is easy to spot, which of the two gives a more accurate representation of the price action.
If you are just starting out with using median lines, it is good to follow this practice of adjusting the median lines.
The trick is to ensure that price action is trading relatively within the upper and the lower bounds of the pitchfork tool.
You can also use some candlestick highs and lows as reference. If you look back on the second chart, you will notice that the interim swing high between the first and second points, neatly respects the median line.
This isn’t the case in the first chart, where the median line is quite off from this interim swing high.
How to trade with median lines?
With the pitchfork tool, you are multiple ways to trade the market.
First and foremost, you should not use this drawing tool in isolation.
If you use the tool in isolation, then you need to be really good at reading price action patterns.
The Andrews median line can tell you two things:
- When price is going to break the prevailing trend
- Potential support and resistance areas
To understand When price is going to break the prevailing trend, you only need to look at price.
A trend reversal often happens when there is a breakout from the median line’s upper or lower bounds.
Note that this trend reversal can be just a short correction, or indeed point to a change in trend. Hence, traders need to be conservative when assessing this point.
This example can be seen in the second chart. After the initial breakout, we have a pullback. If you set a long position at the high forming on the initial pullback, price breaks this level to push higher.
If you look close enough, you will see that the rally ended right near the swing low, or the second reference point.
This brings us to the second part of using the median line which is the support and resistance level.
In case it was difficult for you to understand this, look at the next chart below.
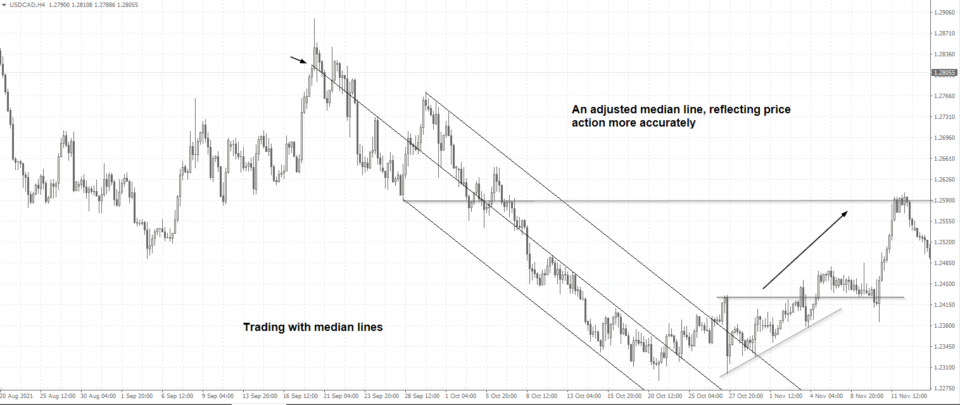
You can see different ways you can trade the breakout.
For example, we see an ascending triangle pattern that is emerging near the bottom. The breakout from the median line already gave us a clue that price could push higher.
Following the breakout from the initial high, we see a gradual movement to the resistance level. This resistance level is nothing but the swing low in the median line.
Traders can use similar methods to trade both the uptrend and downtrend.
Median line trading – Best practices
One of the benefits of median line trading is that it is not dependent on any indicators. All it needs is just price. Hence it is a great way to further understand price action.
If you are well experienced, you can learn when to use median lines and when not to. The Andrews median line indicator can also be plotted on any chart time frame of your choice. Hence, it is suitable for both swing trading as well as intraday trading. You can easily use the same concepts on a 5-minute chart as well as a weekly chart. It is always good to keep the previous median lines. This is because the swing points continue to serve as support and resistance levels.
Avoid using median lines when the market is moving sideways. But remember that just after the choppy markets, you will see a clear trend to emerge.
Patience is key when trading with median lines. As you may notice from the above charts, it takes a lot of time after plotting the median line. The trade is triggered after a few days. Hence, if you are impatient, then median line trading is not ideal for you.
Combining price action techniques such as candlestick patterns and price action patterns can be very beneficial. You need to have at least two different methods of validation before you put on a trade.
Andrews Pitchfork/Median line – Conclusion
In conclusion, the Andrews pitchfork tool is a versatile tool that is very easy to use. Just about any technical charting platform has the pitchfork tool. The best way to learn median line trading is to practice. You can refer to our simple guide chart and train your eye to spot these patterns.
Once you master this, you can then focus on adjusting the median lines to price.
For beginners, it is good to use the median line alongside trend indicators like the moving averages. Oscillators are great when it comes to confirming the reversal in prices, while the median line’s swing points itself can act as targets.