Fibonacci retracement is a type of trading strategy that makes use of the Fibonacci numbers. The goal of using Fibonacci retracements is to identify support and resistance levels.
The Fibonacci retracement numbers are a product of the Italian mathematician, Leonardo Fibonacci de Pisa. The Fibonacci number, 0.618 is sometimes known as the Golden Ratio.

Many beginners to start to use Fibonacci numbers tend to fall prey to the myth about these numbers being mystical.
However, in reality, a vast majority of retail and institutional traders use these numbers in their technical analysis. As a result of this, the Fibonacci numbers become a self-fulfilling prophecy, so to speak. Hence, there is nothing mystical about the Fibonacci numbers, for the mere fact that they are widely used by many market participants.
However, it is worth noting that Fibonacci numbers tend to give a nearly accurate view of potential support and resistance levels. Traders should also remember that Fibonacci analysis is a bit subjective as well.
The only way to master trading with Fibonacci is to practice. Traders apply for the Fibonacci numbers not just for retracements. It also works in technical indicator settings. But there is no proven academic research, or otherwise, that gives any conclusive evidence of the ‘power’ of trading with Fibonacci numbers.
This article gives a detailed outlook on what Fibonacci numbers are, the various Fibonacci trading tools you can use in technical analysis. These methods can be applied to just about any market and not just to currencies.
What are Fibonacci numbers and the Golden Ratio?
We will start with the basics of understanding the Fibonacci numbers.
Leonardo Fibonacci discovered that one could construct a series of numbers, starting from 0 and 1, by adding one number to the other.
Hence, a Fibonacci sequence would be 0, 1, 1, 2, 3, 5, 8, 13, and so on.
One can continue to build the sequence to infinity. In this sequence of Fibonacci numbers, when you divide one number by the other, the result is a number that comes to around 0.618.
This tends to grow stronger especially as the sequence of numbers continues to increase.
This ratio of 0.618 is said to be the Golden ratio.
The Golden ratio gains importance when one starts to look at ratios found in nature. The most famous example is that of the Nautilus shell which illustrates the Golden spiral.
Similar examples can be found in other things in nature, such as the structure of the sunflower seeds. Each sunflower seed is 0.618 of a turn from the previous one. Other examples include the ratio from your forehead to your arm.
It is because of these co-incidences that the Fibonacci numbers have gained a mystical status. Traders tend to use this mystery as a way to gain an edge in the markets.
From a trading perspective, the golden number can be divided further to get the golden ratio subsets.
Typically, besides using 0.618, 0.382 and 0.718 are commonly used, alongside 0.5.

Depending on who you ask, or what strategy you use, you can find many more subsets from the golden ratio. Traders also tend to round up these numbers to get values such as 62, 38, 72, and 50.
These values are then commonly used in technical indicator settings such as moving averages, MACD, Stochastics, and so on.
Fibonacci levels number-based tools in MT4
The Fibonacci number-based tools are now an integral part of any technical charting platform. This includes the MT4 trading terminal as well.
Here, you will find lots of retracement tools that span across identifying support and resistance levels. You also have price channels as well as time forecasting that use the Fibonacci numbers.
In your MT4 terminal, you can access the Fibonacci-based indicators by clicking on Insert from the main menu and then selecting Fibonacci.
Here, you find different tools below:
- Retracements
- Timezones
- Fan
- Arcs
- Expansion
As a beginner, you will be mostly using the retracement tool. To some extent, you may also use Fibonacci-based price channels.
Fibonacci arcs and fans are not that commonly used. It requires a different perspective and will be useful if you are familiar with Gann's methods of trading. Hence, we will ignore these in this article.
How to use the MT4 Fibonacci retracement tool and draw the Fibonacci levels?
- Identify a swing high and a swing low.
- Then, using the Fibonacci retracement tool, you can drag your cursor across these two points.
The Fibonacci retracement tool will automatically plot the values. However, by default, the MT4 Fibonacci tool has a default set of values. But you can modify these by clicking on the settings.
One of the common questions traders have is whether to plot the Fibonacci tool from left to right or vice-versa. There are tons of articles that claim to show you how to draw the Fibonacci levels correctly. The truth is that if you just apply common sense, you will know how to draw the Fibonacci levels.
If you are measuring from a swing high to a swing low, it is usually from the top left to the bottom right.
In doing so, you are looking to see if there will be a retracement. Hence, if you divide this down wave into parts, your first Fibo level will be 38.2% and your next Fibo level will be 61.8.
In the same way, when you want to measure retracements from a swing low to a swing high, you could draw from the bottom left to the top right.
In this instance, your first fibo level will be 38.2 followed by 61.8.
A simple way to remember how to draw Fibonacci levels correctly is to just look at the direction of the price and follow that direction.
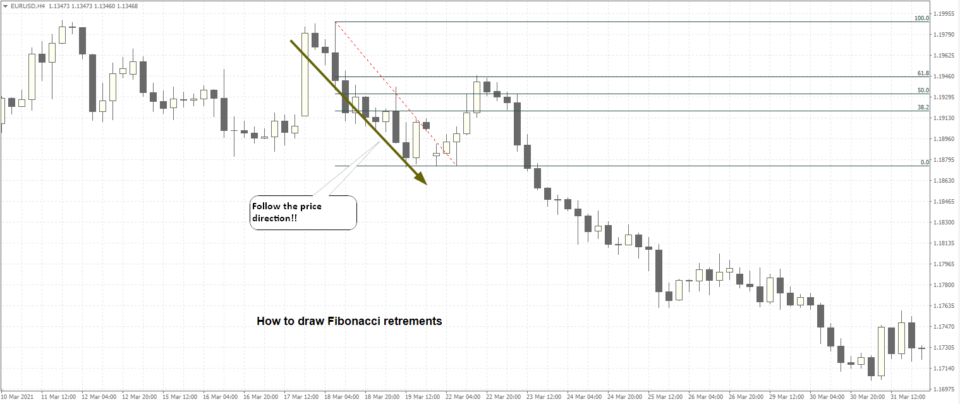
The above chart shows a visual illustration of this.
When the price is moving down, you want to see how much the price can retrace, by moving higher. To do this, just draw the Fibonacci tool from the top left swing high to the bottom right swing low.
Using the Fibonacci price channel tool in MT4
The Fibonacci price channel tool is another unique indicator. However, using this requires a lot of practice and price action context.
The uniqueness of using the Fibonacci price channel tool is to identify three swing points. In a downtrend, this would be a swing high, a swing low, and a lower swing high
Conversely, in an uptrend, it would be a swing low, a swing high, and a lower swing low.
Leaving the default settings are they are, when you connect these points, you get the Fibonacci extensions. Using this tool, you can measure how strong a price movement is going to be if there is a retracement.
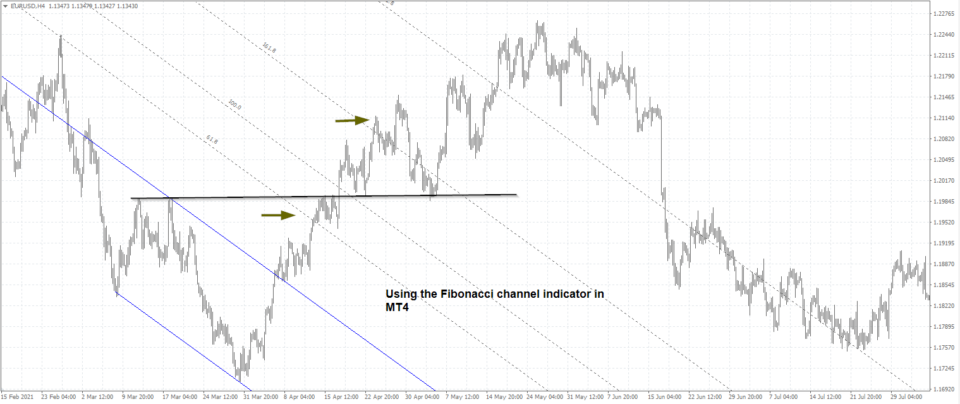
In the above chart, we have a similar illustration.
Firstly, connect the three points, swing low, swing high and lower swing low. Plotting the Fibonacci channel to these levels, you then get the projections automatically.
Upon breakout from the swing higher, you can see how the price rallies to the 61.8 Fibonacci projection level. Plotting a horizontal line to this level, you can then see how this price level acts as support and resistance.
This would be the cue that the market will continue to push higher.
Consequently, you notice how price rallies extending to the 261.8 extension level.
One can further enhance this study by adding the Fibonacci retracement levels. However, this requires a lot more practice.
Beginners can easily get confused with too many lines on the chart. Furthermore, one needs to have a good understanding of the price action concepts to use such methods.
Do the Fibonacci methods always work?
The answer is no!
Bear in mind that the Fibonacci retracement methods are merely an estimate of where the potential support and resistance levels will form. We also mentioned the subjectivity part.
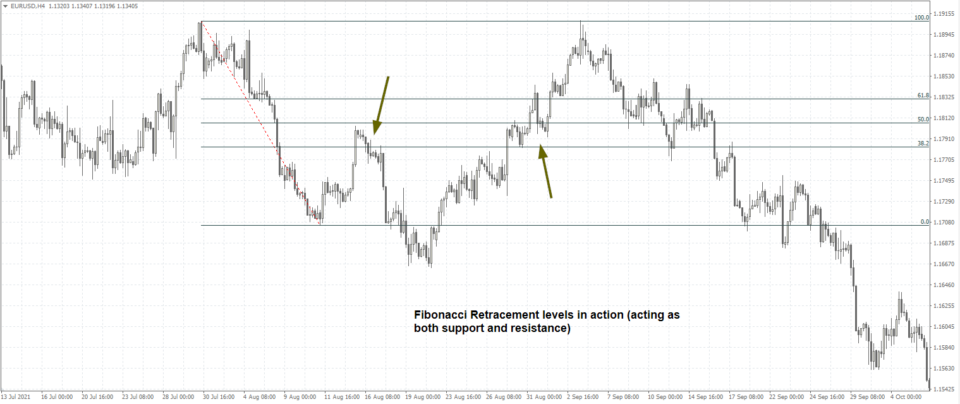
In the above chart, you can see how prices are reacting to these levels.
One may look at the above chart and the price action and dismiss the Fibonacci levels. But if you look closely, you will see how prices are reacting to these levels.
In the first instance, we see a retracement to the 38.2% level before the price breaks down lower to form a new lower low.
Then, a quick rebound from this new low pushes prices back higher. There is a bit of a consolidation that takes place back near the 38.2% to the 61.8% Fibonacci levels. Following this, we see a new lower high emerging.
Eventually, we once again see prices breaking down lower, albeit with another instance of some consolidation happening near the same retracement levels. If one removes the initial Fibonacci levels, then this price action would not many any sense. Especially if you redraw the retracements from the previous high to the new low that formed.
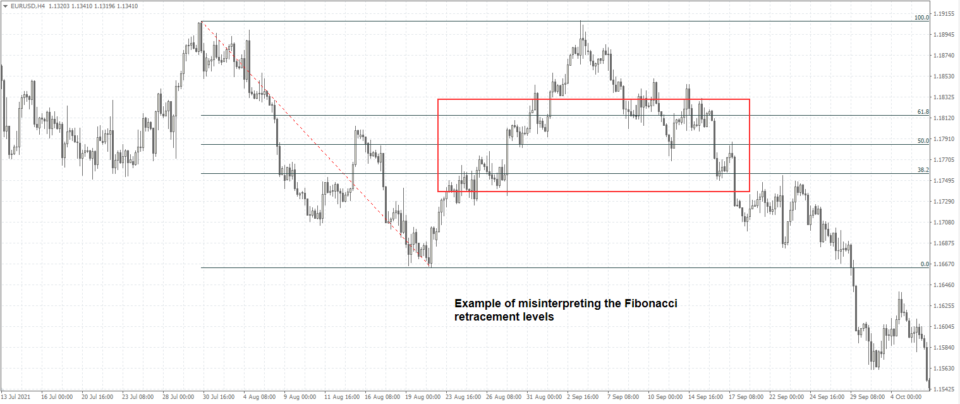
The above chart is the same as the earlier one. The only difference is that this time, we re-draw the Fibonacci retracement down to the new low that formed.
In doing so, you notice how the retracement levels do not make any sense. In both directions, there is barely any retracement. Price action cuts across these Fibonacci levels.
What is the best way to take advantage of the Fibonacci levels?
As with any technical analysis in Forex, trading in isolation, based on just one indicator will not give you the whole picture. Hence, to take advantage of the Fibonacci retracement levels, one should combine this with other technical tools.
Some of the most used trading indicators include the moving averages. This gives you a perspective of the trends.
Using the trends, you can then identify the peaks and the troughs and look for potential retracements levels to occur.
The best way to illustrate this is to use the previous charts once again. But in the below chart, we also add a 100 and a 50-period moving average.
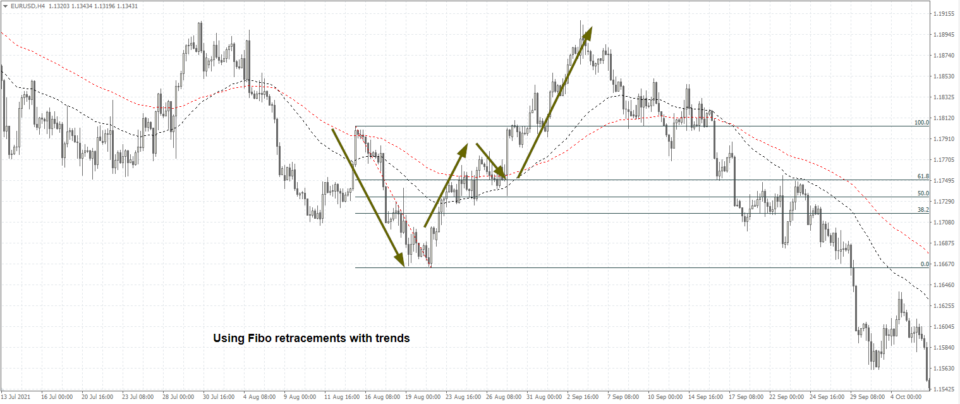
What you see here is now a bit more perspective on the trends.
The Fibonacci retracement shown is measuring whether the price will break down from the low, or if it will reverse direction.
As you can see, the price does reverse direction. However, notice how prices turn the Fibonacci area from resistance to support. You can see a bit of a pullback occurring right before a strong breakout to the upside.
While this example is very simple, it can certainly give you a better edge when you combine the knowledge of Fibonacci retracements alongside trends in the market.
MT4 Fibonacci tools tips and tricks
In conclusion in this article, we will leave you with some tips and tricks when using the Fibonacci methods of analysis.
- Always use the Fibonacci tools in the context of price action and trends. The Fibonacci retracement levels give you a rough estimate of where a potential retracement may happen
- Not all retracements work, because Fibonacci tools are an estimator of price but not a predictor of price. Beginners tend to take the Fibonacci levels at face value only to see their analysis turning sour
- In the MT4 trading terminal, you can easily configure the settings of the Fibonacci tool
- To do this, after you plot the Fibonacci tool, right-click on it and go to Fibo Properties
- Click on the Fibo levels tab and delete or add or modify the levels
- Do not use too many levels as it can clutter your chart
- Stick to 61.8, 50.0, and 31.8 levels initially. If required, you can also use the extensions or projections of 161.8 and 261.8 levels
- In the FIbo properties description, you can add %$ to get the price automatically on the MT4 chart.
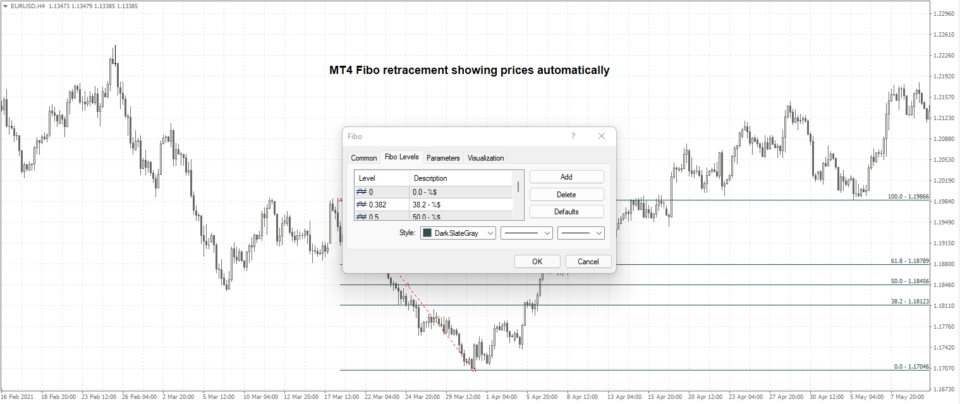
Following the setup shown above, you can see how prices are shown on the right side.
This method holds true for any Fibonacci tool you use in MT4, including price channels and Timezones.
You can also uncheck the Ray to prevent the Fibo lines from extending completely to the right side of the terminal. It can be a useful feature if you have multiple Fibo levels across different swing points.
The Fibonacci retracement levels are certainly a great addition to your trading arsenal. The retracement tool is especially handy for those who are struggling to identify support and resistance levels.


