IMF downgrades the global outlook, calling it “Gloomy and more uncertain”
- Resistance Zone: 4230 to 4260
- Key Resistance: 4090
- Major Pivot Point: 3920
- Key Support Level @ 3815
- Support Zone: 3720 to 3690
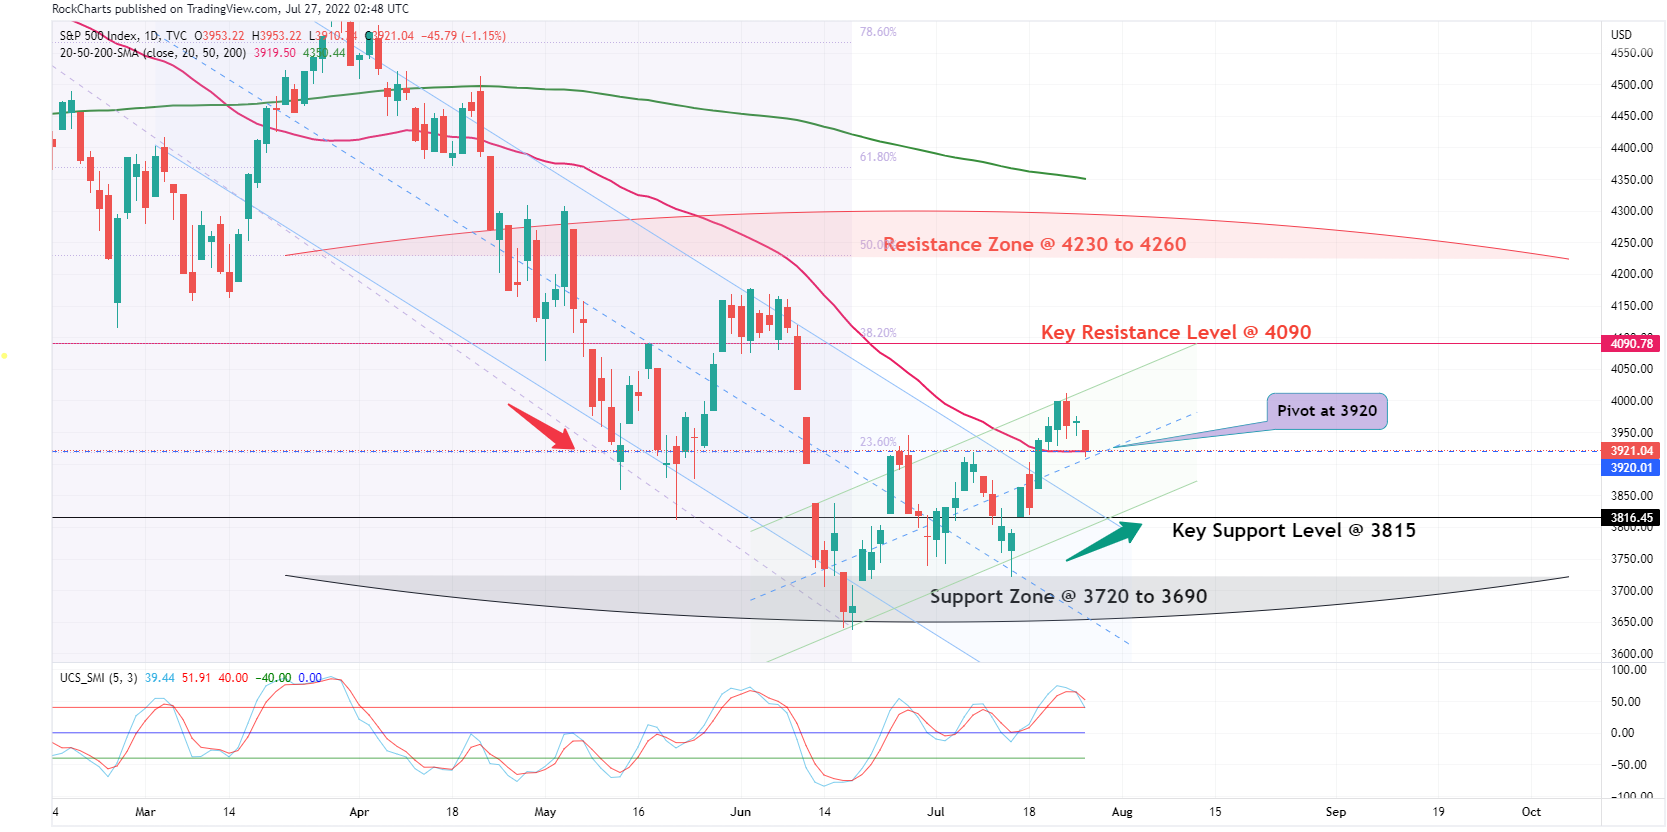
Chart Analysis
The US500 chart shows that the index has moving higher after changing the course on 14th July and currently the market has retrieved a bit just before the Feds Rate decision and IM making a negative observation about the Global economy. Other major events that are keeping investors on the side-lines is the key large cap earnings release this week.
Trade Insights – US500
Chart shows Viable Long Positions above the Major Pivot point at 3920, with the first target of the Key Resistance level at 4090 and then to head towards the Resistance Zone between 4230 to 4260.
Alternatively, Long positions above the Major Pivot point at $3920 with the target to head towards the Key Resistance Level at 4090 and then towards the Resistance Zone at 4230 to 4260.