Whether you are a seasoned trader or not, there are quite a few terms that you will come across now and then. Regardless of whether you are trading stocks or forex, or commodities, there are no doubt some terms that you will often come across.
This article aims to break down such financial market jargon in simple terms. So the next time you hear these financial phrases or market jargon, you will know exactly what they mean.
Rally
A rally in the financial context, should not be confused with an event or a car rally. But rather, the term rally in the financial markets refers to when the market is moving up. The term further gains prominence, especially if the market just recovered after a prolonged slump.
The market action can also be called a rally when prices chalk a bottom as seen in the chart below.

The term rally can be heard and read about, especially after an upside move following a decline. For example, you may hear “The S&P500 index rallied 2% today.” This means that stocks made a 2% rally or a recovery from the previous day.
Rally can also mean an upside movement that is continued from the previous day. For example headlines like “The stock market rallies for a third consecutive day” means that the stock index closed positive for three consecutive days.
Relief Rally
A relief rally comes with context. A relief rally is a small upside movement after the market sold off for a considerable period of time. The relief rally, gives a temporary respite from the bearish market conditions.
It is called a relief rally, because it is an upside move that comes, providing some relief to the bulls. If a relief rally is prolonged, then it is quite likely to take the new name, rally.
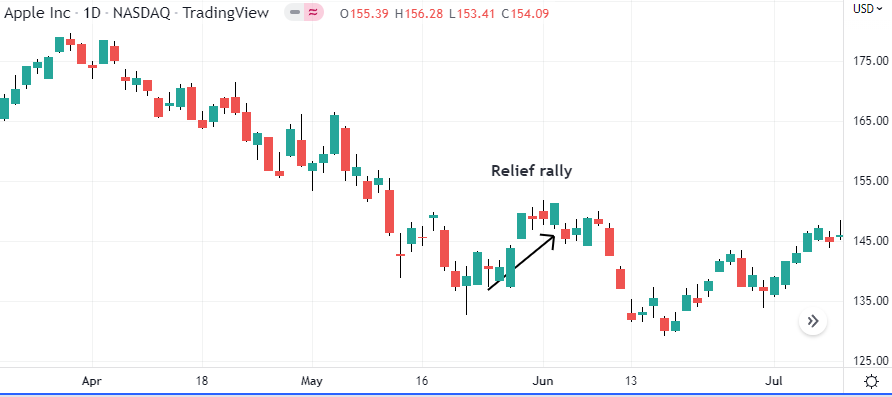
A relief rally provides only a temporary respite from the bearish market conditions. While there is a good chance for the relief rally to continue, in this case, it can become a rally. However, if prices reverse and fall back, it would qualify as a relief rally.
Dead cat bounce
There is a strong correlation between this term and the relief rally. A dead cat bounce however happens over one or two sessions at best, which sort of sets it apart from the term relief rally.
A dead cat bounce is a weak attempt at security to bounce back. It usually happens after a significant decline. The dead cat bounce offers an opportunity for traders caught on the wrong side of the market to exit.
However, sooner than later, the dead cat bounce fizzles and the market resumes it bearish price action. A dead cat bounce often occurs as support levels turn weaker after being tested multiple times
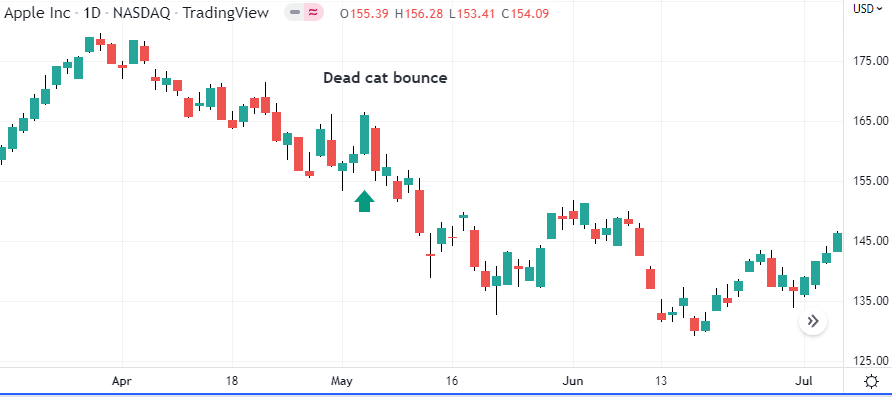
The above chart shows a three-session dead cat bounce. First, the stock price drops from above 175 to around 155. Following this, we see a feeble attempt at prices pushing higher. But following this bounce to 165, the price resumes the decline once again, qualifying for a dead cat bounce.
Sell the rallies
Trend traders may be very familiar with this term and the next. The term sells the rallies is applied when the market is in a strong downtrend. The short-term price corrections that are made during these bearish market conditions are called selling the rallies.
When one is selling the rallies, they are selling into the downtrend.
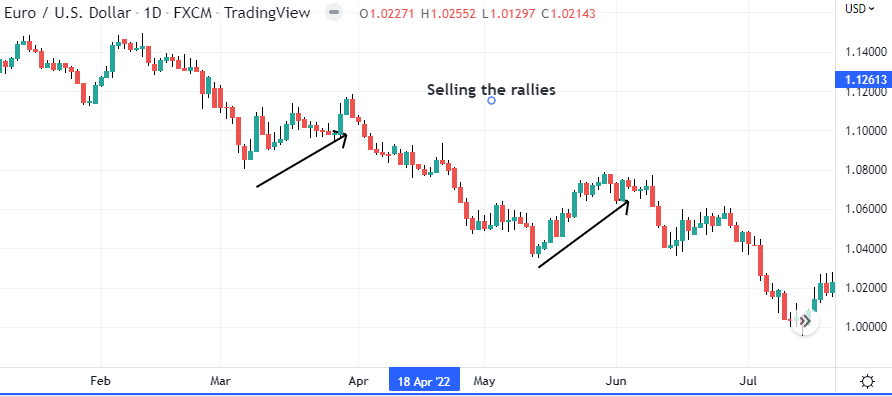
The chart above shows the EURUSD daily chart, which is in a downtrend. The areas marked by the upward pointing arrows are essentially rallies into the downtrend. Therefore, selling the rally in this context means that one can sell into the downtrend, every time there is a bounce.
Buying the dips
Buying the dips is the opposite of selling the rallies. In buying the dip, you are basically buying into the uptrend. Whenever there is a downside correction to the markets, it creates a dip. These dips attract new trend traders into the market.
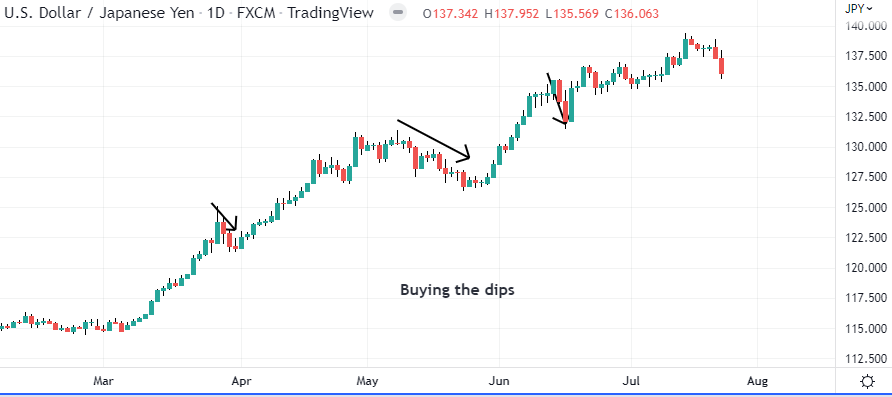
In the above chart, you can see the dips that were created into the uptrend. These small price corrections are essentially dipped to the uptrend. They are considered ideal dips to buy as you enter into the uptrend upon a short-term correction.
Headwinds and tailwinds
These are two terms that you will often come across, especially when reading an analysis piece. A headwind describes conditions that can impede progress. Conversely, tailwinds are conditions that are can favour progress. The best way to remember these two terms are, headwinds are opposing forces, while tailwinds are forces favourable.
Both these terms are used in the context of a business or an economic description. For example, a title such as "the pound sterling will have to fight new headwinds" means that there are fundamental forces that can be detrimental to the pound sterling's appreciation.
On the other hand, if you come across a title such as "the ECB news offered the euro a much-needed tailwind" means that the ECB news was positive for the euro to appreciate.
Caught a bid (Catching a bid)
The term catching a bid, or the phrase, the security caught a bid simply means that the security is moving to the upside. The term comes from the bid and asks prices. Bid prices are used by buyers, while sellers ask for the selling price. Therefore, when there are a lot of buyers, they are bidding on the price of the security or the instrument, therefore pushing prices higher.
The term caught a bid is often used in conditions where the security or an instrument fell sharply in the previous session or was in a downtrend. Stocks caught a bid, which simply means that stocks moved to the upside.
Circuit breakers
Circuit breakers in electrical terms are used to break the circuit to halt the flow of electricity. In financial terms, circuit breakers are used to halt trading activity. Following the many market crashes, various stock exchanges now implement circuit breakers.
These are automatic triggers when the stocks fall a certain percentage in a day. Circuit breakers are put in place to prevent mass panic or trading-induced short selling. Typically circuit breakers kick in when prices drop 7%, 13% and 20% from the previous day’s closing prices.
These are temporary 15-minute halts to allow the market participants to catch their breath.
Alpha & Beta
Alpha, in the financial markets refers to the excess returns of an investment, above its benchmark. Portfolio managers and hedge funds often strive to generate alpha for their clients. If for example, a hedge fund generated an alpha of 1%, it means that its investments beat the market by 1%.
That is assuming the market, or the benchmark, in this case, being the S&P500 rose 5% on the year. Then the total returns generated by the hedge fund would be 6%, with a 1% alpha, which is the excess return.
Beta on the other hand pertains to the volatility of the security or portfolio relative to the benchmark. Note that beta is also similar to alpha, with the only difference being that it measures excess volatility.
By definition, the market has a beta of 1. Hence, securities with a beta of > 1 are more volatile than the benchmark, and securities with a beta < 1 are less volatile than the benchmark.
Alpha and beta are risk ratios, often used in risk management circles. Some investors also use these ratios as a way to filter stocks, especially beta which can show you very volatile or low-volatility securities.
Double dip (recession)
In the context of GDP, a double dip, as the name suggests is when there is a dip twice. Consequently, it means that there is a period of positive growth. A double-dip recession is the most common term you can come across.
Hence, when you hear a term such as "the use economy came out of a double-dip recession" it means that in the past three quarters, the US economy saw a period of negative GDP growth, followed by positive GDP growth and negative GDP growth.
Bips (or beeps) – bps
Bps is most commonly used when it comes to interest rates. For example, when you read a headline such as “The ECB hiked rates by 50bps” it means that the ECB hiked interest rates by 0.50%. The word BPS refers to basis points.
One basis point is one-tenth of a percentage point. Therefore 100 basis points or 100bps refers to 1%, thus, by extension, 50 basis points would be 0.50%.
Opening and closing bell
The opening bell and the closing bell mark the start and end of the trading session. The term comes from the older days of trading where trade was conducted in the Pit. The exchange would ring a bell to mark the opening of the trading day.
Likewise, they would ring the bell marking the end of the trading day.
The pit
Also known as the trading pit, this was where trading used to take before technology took over. Traders would converge in the centre of a stock exchange and shout out prices for buying and selling.
Traders would carry slips of paper with them writing down details of the transactions such as the price and quantity at which a trade was concluded. With the advent of technology and electronic trading, the trading pit has almost disappeared.
Fat fingers
Fat finger is a term used to describe an error caused by human error. Typically referred to as any typo when it comes to trading, a fat finger error simply means that an incorrect order was made. For example, instead of placing a sell order for 100 shares, a trader may erroneously place an order for 1000 shares.
Fat finger traders are exactly that, erroneous trades. However, they are known to have caused market distress, especially since they take the market by surprise. A mistakenly large sell order can cause the markets to move adversely.
FOMO – fear of missing out
FOMO or the fear of missing out is a psychological concept. It is usually used to describe a situation where a trader fears that they are missing out on a trading opportunity.
Consequently, they end up entering a trade a bit too late, purely because they fear they are missing out on a golden opportunity. FOMO is often used when the market was in a bullish trend and it attracts a lot of new buyers. These new buyers end up buying right near the top, purely because of FOMO.
Hawks and doves
Hawks and doves are two terms used to describe the opposite ends in the context of monetary policy. Monetary policy hawks are supporters of hiking interest rates, while monetary policy doves are those in favour of cutting interest rates.
The hawks and doves are two terms often used when it comes to monetary policy circles. Also, a hawkish view means that one is bullish or positive while a dovish view means that one is bearish or has a negative view.
Open outcry
Open outcry is a way of communication between traders at an exchange. This is often seen in the trading pits or on the trading floor. Traders shout or make use of hand signals to convey information across the trading floor. The open outcry auction is where all bids and offers must be made in public, giving all participants full knowledge of the market prices.
With the decline of trading floors or pits, the open outcry is also declining as a result.
O/N, T/N, S/N
These three terms stand for overnight, tomorrow next tom next, and a spot next. These are tenors that pertain mainly to the forex forward markets. These are also known as pre-spot and short tenors.
Overnight or ON is the period between today and the first available business day (most likely tomorrow if during a weekday), hence the term overnight. Tom next is the period starting tomorrow and the first available business day after that. Simply put, Tom next starts tomorrow and goes to the next available business day.
SN or spot next is the next available day after the spot date. The spot date is today, but two days from now. Hence, the first available date from the spot date (2 days from now) is called the spot the next day.