Crude oil is one of the commodities that is broadly used across the world in different sectors. Without crude oil, the economic engines of the world would come to a standstill.
While the world is attempting to move away from resource-intensive commodities such as crude oil to greener resources, oil markets still have a long way to go.
If you have been trading forex and CFDs for a while, chances are that you would have come across the crude oil CFD market. As the name suggests, these instruments are derivatives of the crude oil spot market.
Contract for differences allows you to speculate on the price movement for the underlying asset. In this case, it happens to be the crude oil market. Without any additional hassles of owning the underlying assets, day traders can profit from the volatility in crude oil.
But, although it may seem as simple as buying and selling, crude oil CFDs are quite different, if you look beyond the mere oil price charts on your screens.
This article aims to educate the reader about the crude oil market and how one can trade the crude oil CFD contracts. By the end of this article, the reader should gain a sufficient understanding of the landscape in the oil markets.
You will also learn about the signs to watch out for if you want to trade crude oil CFDs.
What are the different types of crude oil?
We will start with the basic question!
There are many different versions of crude oil. Most of these versions are traded in the futures market. But among these, two specific versions of crude oil are important.
- WTI Light Sweet Crude oil
- Brent oil
Other versions of crude oil include the Arab Extra light, Arab Heavy, Murban crude oil and many more. The reason why WTI and Brent, as they are commonly called are popular is that they are very liquid.
If you want to trade crude oil CFDs, then the first step is to understand what type of crude oil you are trading.
Although the different versions belong to the same family of “crude oil,” the prices and their characteristics differ. This includes even the way the fundamentals impact each of the crude oil futures contracts differently.
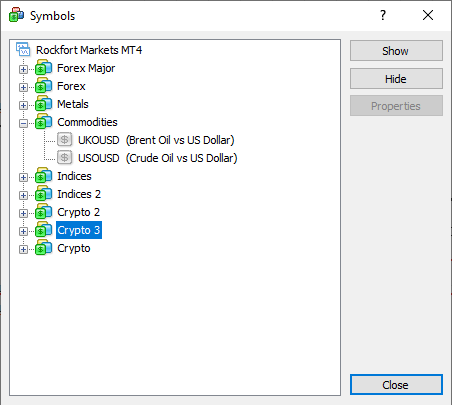
Many brokers offer crude oil CFDs for the WTI version. In some cases, you will also find the Brent Oil CFD contracts as well.
The easiest way to differentiate what type of crude oil version you are trading is by looking at the instrument’s description. Almost all brokers who offer CFDs will provide details into the kind of crude oil CFD contract they offer.
Alternatively, you can simply look at the price itself to understand which version of crude oil you are trading.
The WTI version of crude oil typically trades around $50 - $70 a barrel these days. Whereas the Brent crude oil trades around $60 - $70 these days. If course, prices may change over time.
Hence, traders should check out the crude oil CFD instrument description before they begin to trade.
What is the difference between WTI and Brent oil CFDs?
The WTI crude oil version stands for West Texas Intermediary. This is a form of crude oil that is lighter and considered sweeter than its peers.
As the name suggests, WTI crude oil is delivered to Cushing, Oklahoma, US. Therefore, you may also see WTI crude oil going by other references. These include Cushing oil spot prices or NYMEX benchmark light crude oil.
The WTI crude oil is produced in the United States in Texas and Southern Oklahoma. Therefore, WTI prices are mostly concentrated to the U.S markets.
The Brent crude oil, on the other hand, is also known as international benchmark crude oil. The brent oil is produced near the Northern Sea. When one talks about crude oil prices, then it means that they refer to the Brent oil prices.
The Brent crude oil is not specific to the United States and hence it goes by its other name as the international crude oil.
Because of these subtle differences between WTI and Brent oil, you will see that although price action mimics each other, the price levels are different.
The chart below shows a comparison between WTI crude oil and Brent oil continuous futures contract charts.
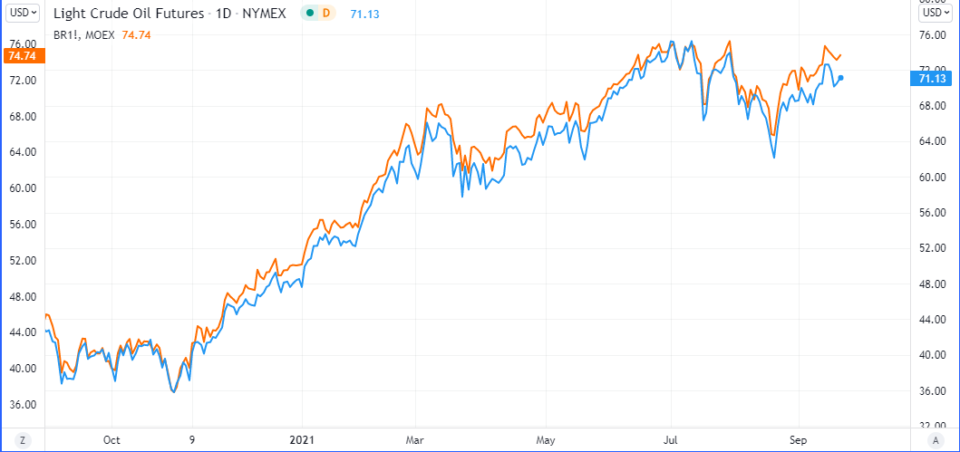
You can observe how prices for the Brent oil and WTI crude oil trade are quite close together. But the levels of the prices differ, as mentioned earlier.
You can also see that the price action does not mimic each other exactly. This means that there are times when Brent and WTI crude oil prices tend to diverge.
Crude oil pricing convention
As crude oil is a commodity, the contract size specification is important to understand. Without knowing the contract specifications, it would be difficult to explain what it is that you are trading.
At the outset, a crude oil futures contract size of one equals 100 barrels of crude oil. This means that if you purchased one oil contract, where the price of crude oil is $50 a barrel, then a futures contract is worth $5000 ($50 x 100 barrels).
When it comes to Oil CFDs however, there is leverage involved. In many cases, the leverage is close to 50%, meaning that one oil CFD contract is worth one barrel of crude oil.
Therefore, when you trade crude oil CFDs, you are typically controlling one barrel of crude oil. This is easier than managing one futures contract which obviously requires a higher margin.
With crude oil CFDs, if you keep your position open overnight, then it attracts the overnight rollover or financing fee.
This is regardless of whether you are long or short in the oil market. These overnight swap rates are mostly negative, meaning that the amounts will be deducted from your trading capital.
To avoid this, one can day trade the oil markets. The downside of this being that you may be forced to look for trades every day, which can, in turn, lead to overtrading. This overtrading can create the risk of taking on more losing trades.
What are the fundamentals that impact crude oil prices?
Crude oil prices (both WTI and Brent) are quoted in US dollars. Hence, at the outset, the strength of the US dollar plays a direct role in impacting the prices of crude oil.
That is not to say that oil prices rise when the USD weakens. Since there are equally important factors that directly affect crude oil, the strength or weakness of USD is limited to an extent.
On any given trading day, amid the lack of any other fundamentals that impact crude oil, the strength of the US dollar on oil prices can be felt.
Another factor to bear in mind is OPEC.
OPEC is short for Organization of Petroleum Exporting Countries. It is one of the oldest oil associations, often referred to as the oil cartel. It is primarily made up of Middle Eastern oil-exporting countries.
More recently, Russia has also joined the group, but it is referred to as OPEC-Russia. Among the original OPEC nations, Saudi Arabia is the leading oil producer. Hence, it carries a lot of clouts when it comes to decision-making.
OPEC meets twice a year and decides on the oil supply. As a result, the oil cartel has the ability to influence oil prices directly but limiting supply or by flooding the markets with crude oil.
This was evident in the 1980s when an oil embargo led to oil prices rising close to $30 a barrel. Oil prices peaked at $140 a barrel by 2008, during the financial crisis.
Following this, OPEC decided to flood the markets pushing oil prices lower since 2014.
If you are trading crude oil, then it is important to track the OPEC meetings. Comments from the respective oil ministers about crude oil can move the markets.
More recently, Russia has also gained the ability to influence oil prices significantly.
Crude oil CFD – Reports and other economic data
It is not just the OPEC meetings but also more frequent reports that oil traders should pay attention to.
The EIA and API report
For one, the United States EIA (Energy Information Administration) releases weekly crude oil inventory reports. This report shows the total inventory levels for commercial crude oil usage.
Depending on how high or low the inventory levels are, traders assess if demand is outstripping supply or vice versa. Oil prices tend to react to this report.
Ahead of the EIA crude oil inventory report, the API or the American Petroleum Institute also releases some data.
This is considered by many to be a precursor to the official EIA report. Although there are times when the API report deviates quite a bit from the EIA report, the data broadly matches one another.
Therefore, traders should also look for the API report that comes out on Tuesday, ahead of the EIA report which is released later in the week.
Platts Weekly Rig Count
The S&P Platts weekly rig count is a report that is released late on Friday. It comprises information such as the number of oil rigs in use. When comparing this data on a week-to-week basis, oil traders can assess the activity on the supply side.
A significant increase in oil rig usage can infer that supply is picking up. When viewing this information in the context of the global oil market, it can reveal quite a bit of information.
There are times when the markets don’t react much to the oil rig data, but there are times when this report can also move the oil markets.
Oil Futures CoT Report
Since crude oil is primarily traded as a futures contract, it is also subject to the CFTC’s weekly commitment of traders’ reports.
The CoT report as it is known compiles a list of data across producers, speculators, and intermediaries. The information shows data such as the open position, net long and net short, open interest, and so on.
The Oil CoT report can show data such as whether investors are net-long (suggesting being bullish) or net short (bearish) in the oil markets.
A crowded net long or net short comparing to historical highs or lows tend to see the market snapping out from its previous trend.
The Middle-Eastern Geopolitics
Oil traders should also pay attention to the geopolitics of the Middle East. Since most of the crude oil is exported from this region, the geopolitics of the region is important.
More importantly, news such as attacks on oil containers and drilling facilities, and the Suez Canal can immediately impact the oil markets.
Because of the US influence in the Middle East, the foreign policy of the United States also plays a big role.
An easy way to keep track of this is by following the daily news and assessing its impact on the supply chain in the oil markets.
Technical analysis methods for Oil CFDs
Besides the fundamental factors outlined earlier, technical analysis is also equally important.
Due to the volatility in the oil markets, a wrong trade can prove to be quite expensive. Therefore, oil traders also make use of technical indicators when trading Oil CFDs.
The chart below shows the 30-day volatility for crude oil. Also known as the CBOE Crude oil volatility index, this is similar to CBOE VIX, which is the volatility index for the S&P500 equity index.
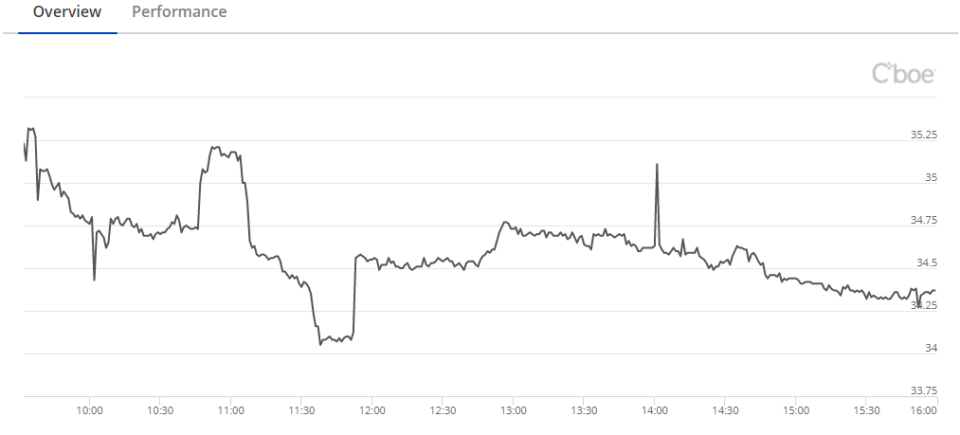
These include basic indicators such as moving averages, Bollinger bands, oscillators such as RSI, Stochastics, etc.
One of the key aspects of trading crude oil CFDs is that the trends persist for much longer. Therefore, one should typically start looking at the oil markets from a monthly view, drilling down to the daily and intraday charts.
You will see whipsaw price action on the short-term charts, comparing to the steady trends in the higher chart time frames. Therefore, picking out trades that have a higher probability of moving within the same larger trend direction is important.
There are quite a few technical trading strategies out there that oil traders can use. Break-out trades are also quite popular when trading crude oil CFDs. These breakouts tend to occur quite frequently and are best suited for day traders.
Why trade crude oil cfds?
So far, you have learned the basics of crude oil CFDs and how they work. You also have a good idea of the fundamental factors involved when trading oil cfd contracts.
The obvious question that comes to mind is why trade oil CFDs in the first place.
The answer to this depends on a trader’s choice. When it comes to diversification, oil as a commodity is something that is used in everyday life. Hence, you are effectively trading something that is very tangible.
As a commodity that is influenced by supply and demand, crude oil CFDs are easier to relate to comparing to trading gold or other forex instruments. The trends in the oil markets attract traders and its volatility offers many trading opportunities.
This makes crude oil CFDs a great way to speculate and day trade, which is both dynamic but also risky at the same time.