A trading strategy will be one of the key things that traders will spend a lot of time on.
Many beginners often spend a lot of time testing out one strategy from another. This can happen until one finds a strategy that is unique to them.
There are many ways to bell a cat and similarly, there are many ways to trade the financial markets.
Traders often make the mistake of automatically building up a bias for a trading strategy. Generally, traders think that the more complex a trading system is, the better its results.
But this is not the case. Also, a trading strategy with a higher win rate doesn’t always mean profits.
In fact, if you look at most trading systems, you will see that the number of losing trades is higher than winning trades.
Yet, it is all about capturing maximum profits during a winning trade. This can eventually bring about consistency to your trades.
The key to finding a trading strategy that can work for you is to find something that is simple and one that you can understand.
This article aims to introduce traders to three easy to use trading strategies. It comprises a mix of both long term and short term trading strategies.
Furthermore, the three strategies are also suitable for both day traders as well as part-time traders. We should mention that the trading systems we talk about here also require some knowledge about the market.
These strategies will not work if you merely apply them without having the market set up in context.
So, we recommend that before using the trading strategies in this article, you should learn about the fundamentals and also have some understanding of how to read the financial charts.
Support & Resistance Failure Method
The Support and Resistance failure method is applied on the daily chart.
The concept behind this strategy is to wait for a support or resistance level to fail in order to take a long or short position.
Traders do not need to spend too much time on this strategy. However, one might need to wait for a while for the trade to be triggered. This can mean having to wait for days on end.
But if one is disciplined enough, this strategy will yield significant profits.
The Support and Resistance Failure method can be applied to any chart time frame. However, we prefer using the daily time frame. This is because the candlestick patterns are more reliable.
The strategy requires using price action, candlestick patterns reading and the Stochastics oscillator. We also apply concepts of divergence in this trading strategy.
The first step is to look for a key support level or resistance level off which price bounces off.
Once this happens, using the Ray tool, mark the support or resistance level of interest.
Finally, simply wait for the price to break out from this level.
We look for validation to the Stochastics oscillator and also for any divergence patterns for confirmation.
In the chart below, we have an example for a short trade. Here, we first see that price falls to 1.1665.
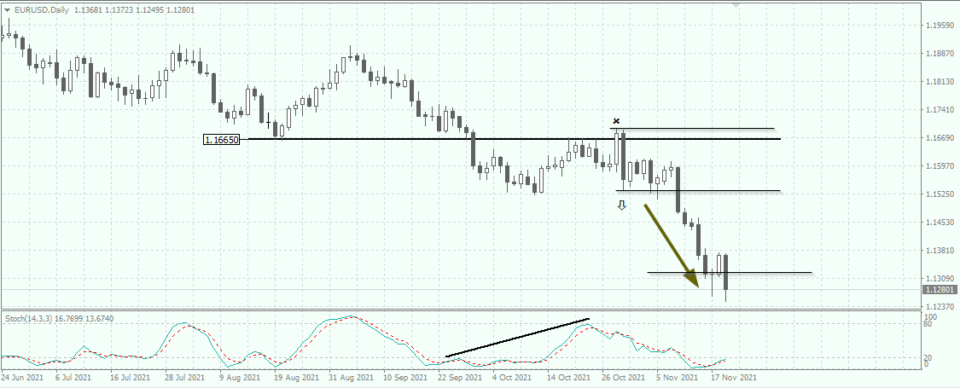
After this, we see a slight bounce occurring. The EURUSD rallies back to the previous resistance area of 1.1887 before losing steam.
As the price falls back to the support area at 1.1665, we look to the Stochastics oscillator. We can see the hidden bearish divergence after the breakout.
A bearish engulfing pattern confirms the downside, and we can now take a short position in the market with a good risk/reward set-up.
Pros and cons of the Support & Resistance Failure Method
This trading strategy primarily works on the daily chart. Therefore, traders who prefer scalping or day trading action may find this set-up to be a bit boring.
On the other hand, traders who do not have time to trade will find this to be an ideal part-time trading strategy.
Still, even the part-time traders may need to monitor the charts. The best way to overtime this is to set up a price alert near the support or resistance level of interest.
One could also set a pending order after identifying the support or resistance level. However, bear in mind that you will need to look to the Stochastics oscillator for confirmation of the trade.
The risk to reward ratio is quite large and therefore, the profits can easily outperform the losing trades.
During times of market choppiness, you may find the support and resistance levels being hit multiple times. This is where you need to ensure that your technical analysis is sound.
Traders can also find it beneficial to focus on the fundamentals for the instrument that you are trading.
Inside Bar Breakout Strategy
The inside bar breakout strategy, as the name suggests is a trading set-up that looks at the breakout from the inside bar.
The inside bar is a candlestick pattern. The preceding candlesticks’ high and low remain within the high and low of the previous candlestick.
You can have just two candlesticks based inside the bar. It is also common to find multiple inside bars. This is when two or more candlesticks emerge within the main inside bar.
An inside bar forms during market uncertainty. This is when volatility drops, and you can see whipsaw prices.
Many times, an inside bar formation leads to a strong breakout.
Traders generally wait for the price to break out first before trading this method. However, there are other ways to trade as well.
The inside bar breakout method is used on the daily chart because of the reliability of the daily session candlesticks. One can also look to the weekly candlesticks for clues.
This method is ideal if you want to target a consistent number of pips per trade. The risk to reward setup is not that great. And quite often, because you target only a specific number of pips, you may lose out on riding the breakout trend.
Still, this is a strategy that if applied diligently can allow you to make a consistent number of pips in profit.
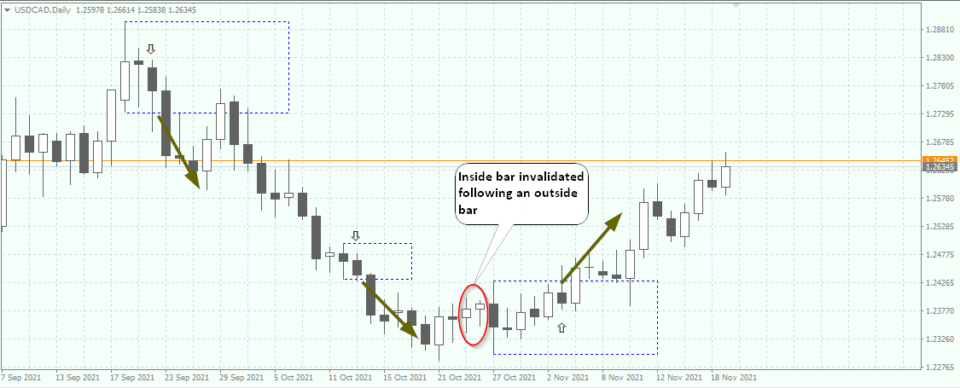
The first step is to look for an inside bar to form on the daily chart and plot it's high and low.
Prior to the breakout, look for the candlestick that initially tests the high or the low, but closes within the inside bar’s range.
After this candle, take a long or a short position depending on whether the high or the low was tested.
Pros and cons of trading the inside bar breakout strategy
The inside bar breakout strategy primarily requires one to be good at reading candlestick charts.
This trading strategy will not work if you merely look at the inside bars and trade blindly. On the contrary, traders need to understand where the inside bar is forming.
If the inside bar forms within a bearish trend, then there is more bias for a short trade. On the other hand, if the inside bar appears near a low after a prolonged downtrend, then there is a good chance of a reversal movement.
No matter what, traders need to understand the context of the trend to trade this method.
Since we cannot predict where and when the inside bar forms, you may find yourself staying out of a trade for prolonged periods of time.
However, the key here is to remain patient.
Part-time traders need to carefully look at the charts on a daily basis in order not to miss the breakout when it happens.
While this trading strategy can be applied to the short term charts, we find it to be more reliable on the daily chart time frame.
Trend Following through Moving Averages and Divergence
For those who are interested in a trend following strategy, this next method will prove to be ideal.
As the name suggests, this is a strategy that is useful when you want to ride the trend.
Obvious of its name, we make use of trend indicators such as moving averages and the Stochastics oscillator.
You can of course switch the Stochastics oscillator with RSI or any other oscillator of your choice.
The key with this trading system is to utilize the oscillator to spot divergences that form within the trend.
It is ideal to pick up the first valid divergence that forms within the trend. This is because as the trend evolves, the subsequent divergences tend to grow weaker. The risk-reward setup for this method is quite big.
Therefore, there is a potential to make larger profits, while limiting your losses to the minimum. We trade this method on the 1-hour chart.
For the choice of instruments, it is better to trade commodities, indices or stock CFDs. Trends in these markets are much stronger compared to the forex instruments.
We use three exponential moving averages, made up of 20, 50 and 100 on the 1-hour chart.
Once you see the three EMA’s signalling a change in trend, the next step is to wait for the divergence to validate this trend.
For example, in a bearish trend, look for hidden bearish divergence, and likewise, in a bullish trend, look for hidden bullish divergence.
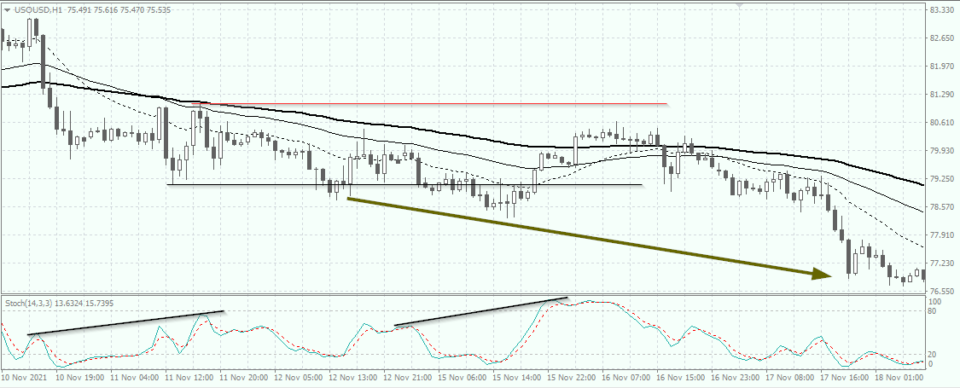
In the above chart, you can see the three EMA’s in a bearish trend. Following this, we have a hidden bearish divergence. Spotting the low, take a short trade while setting the stops to the recent swing high.
After the trade is initiated, you can now monitor your trade and book profits frequently.
Pros and cons of trading the moving average and divergence strategy
The moving average and divergence strategy is to be used on the short term charts such as the one-hour.
It can be tempting to use this trading system in the forex markets. However, bear in mind that the trends are strongest in the commodity markets. It is a similar case with stock indices and stock CFDs too.
Therefore, you will find more success in sticking with the commodity or equity markets rather than in currencies.
Good knowledge of divergence is required, which may put off some beginner traders. However, once you are able to identify the divergence patterns, this trading system is very easy to use.
Because we trade this on the one-hour chart, this trading system requires one to constantly watch the markets. Once a trade is in play, you may need to monitor the trade at regular intervals.
The key is to ensure that you are able to move your trades to break even. This will ensure that you can easily manage your trades without leaving any risk on the table.
It is also advisable to split your trades so that you can book profits at regular intervals.
Conclusion – The key to a winning trading strategy
To conclude, the key to a winning trading strategy, whether you are trading forex, or commodities or indices is to gain familiarity.
Traders make the mistake of blindly jumping from one instrument to another, testing a trading strategy.
If you do not spend time analyzing your trades and understanding the market you are trading, you may not make much progress.
Therefore, the first things one should do is to start with a demo trading account.
Then figure out which instrument or instruments that are of interest to you. The goal here is to find some instruments of interest and stick with them.
Learning how the fundamentals work and how these instruments behave is important. Hence, one should spend a minimum of three months, if not more practicing to gain familiarity.
Profiting from day trading will not happen overnight or right after you find the Holy grail trading system. On the contrary, it is a mix of practice, familiarity and risk management.
While it is possible to make profits in the short term, you won’t be able to go too far. All it will take is one losing trade to erase all your profits.
The trading strategies outlined in this article are no doubt easy to use. But you need to know what is happening in the market. The strategies work based on specific market conditions. And as you may know, the market conditions will change from time to time.
Hence, traders should pick out a strategy they like and run with it. Over time, as you gain familiarity, you can then start to customize the strategy to suit your personality.