The chart pattern is a form of technical analysis that looks at certain recurring patterns in prices.
Technical analysis after all looks at past price history to predict future price movements. Over time, traders have noticed some specific patterns that emerge.
Analysing these patterns, one is able to draw conclusions on the likelihood of what price can do.
An important point to remember is that chart patterns are simply trading opportunities with a higher probability.
But probability does not guarantee returns all the time. Despite being efficient, a chart pattern is also prone to fake price action. Therefore, risk management continues to remain a crucial aspect when trading with chart patterns.
This article looks at the different chart patterns that are available. We also focus on the most profitable chart patterns that you can use.
These chart patterns come with a higher probability of success.
More importantly, trading with chart patterns doesn’t mean that you have to give up on your current trading system.
On the contrary, chart patterns can help improve confidence in your trading decisions.
Hence, a chart pattern, when identified correctly can lead to greater profits in trading. The fact that they are independent of the time frame means that it is suitable for any kind of trader.
To trade a chart pattern profitably, traders should focus on practicing with a demo account. The more screen time you get, the higher the chances that you can use this without any effort.
Divergence to oscillators such as the Stochastics or the RSI or MACD is also very helpful. Quite often, chart patterns occur at key points in the trend. Hence divergence is a great tool to spot anomalies when using chart patterns.
So without further delay, let’s look at what chart patterns in forex trading are all about.
What is chart pattern in technical trading?
Chart patterns are merely patterns that occur in price action. They are more frequent and can occur in any time frame.
Chart patterns should not be confused with price action patterns, although the term is loosely used. Some traders also tend to use the term chart patterns to also describe candlestick patterns. This is completely wrong.
The differences between candlestick patterns and chart patterns:
- Candlestick patterns deal with patterns on a candlestick level. This is the individual session of the security or instrument that you are analysing. More details about candlestick analysis can be found here.
- Chart patterns on the other hand look at multiple candlesticks that eventually evolve into a pattern.
Therefore, chart patterns can take 50 or even 100 or more candlesticks. Another important aspect of chart patterns is that they can be used as a trend-following strategy as well as a counter-trend following strategy.
Since a lot of traders prefer to trade with the trend, chart patterns-based technical analysis only adds to the benefit.
Chart pattern can be broadly classified into two main types.
Reversal chart patterns
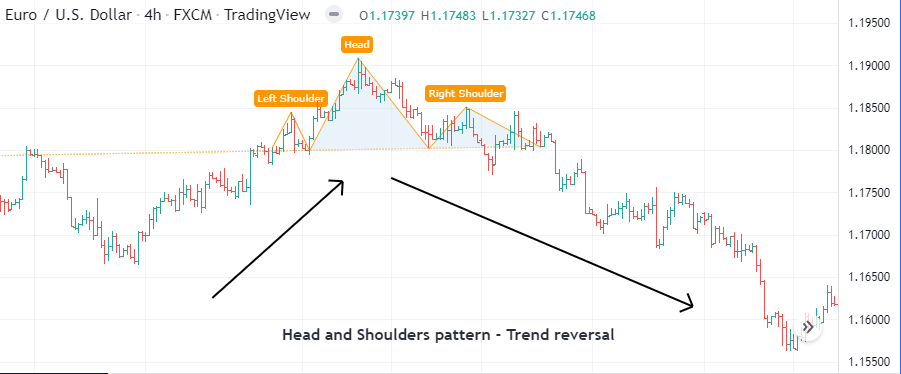
Reversal chart patterns as the name suggests are patterns that indicate a possible reversal in price action.
These patterns usually occur at the top end of an uptrend or at the bottom end of a downtrend.
In some rare cases, they can occur in the middle of a trend, suggesting a correction as well. But such patterns are not that frequent. Depending on the time frame that you are using, the chart pattern can signal potential price action movements beforehand.
Examples of a reversal chart pattern include the inverse head and shoulders and the head and shoulders pattern, and the double top or double bottom patterns.
It is important to note that double tops and double bottoms are not very reliable and are prone to fake-outs.
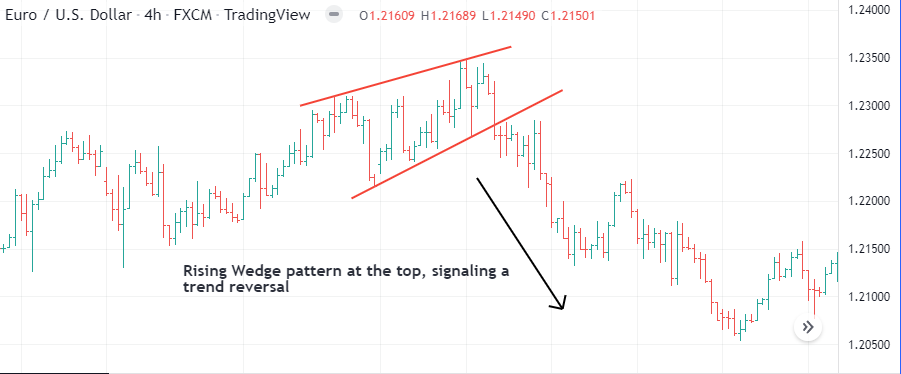
You also have the rising and the falling wedge patterns which are reversal patterns when coming in at the top or bottom of a trend.
Continuation chart patterns
Continuation patterns, as the name, suggests indicating a continuation of the prevailing trend.
Continuation chart patterns occur when a strong trend emerges. A temporary short-term reverse price movement tends to create these continuation chart patterns. You can often spot the continuation chart pattern right after a strong short-term move in prices. Typically, prices tend to stop and consolidate for a while before picking up on the previous trend.
It is during these moments that continuation chart patterns commonly occur.
Some of the very popular continuation chart patterns are the bullish and bearish flag or pennant patterns.
Exceptions
Between the two, there are some patterns that can fit into both categories, depending on the context.
One such example is the cup and handle pattern.
Depending on where this pattern occurs, it can signal a reversal of the trend, or a continuation of the trend as well. For example, a cup and handle pattern near the top end of the trend can signal a continuation to the upside.
Likewise, the same occurrence at the bottom end of the trend can signal a reversal.
On the flip side, we also have the inverse cup and handle patterns, which take the opposite form. Such reversal cup and handle patterns are quite rare.
How to trade the chart patterns?
The first thing to note is that the chart pattern falls into a category of trading called measured move. A measured move, as the name, suggests indicates a measured movement in prices.
For example, if your measured move shows a 10 pip movement, then if the pattern is valid, you can expect the price to move at least 10 pips in the opposite direction.
But as with anything to do with technical analysis, not everything can be quantified. This means, there is a certain element of subjectivity.
Price will not always move the exact number of pips. In some instances, it can move twice or thrice the measured move.
The goal here is for traders to pick a high probability area to capitalize on these movements.
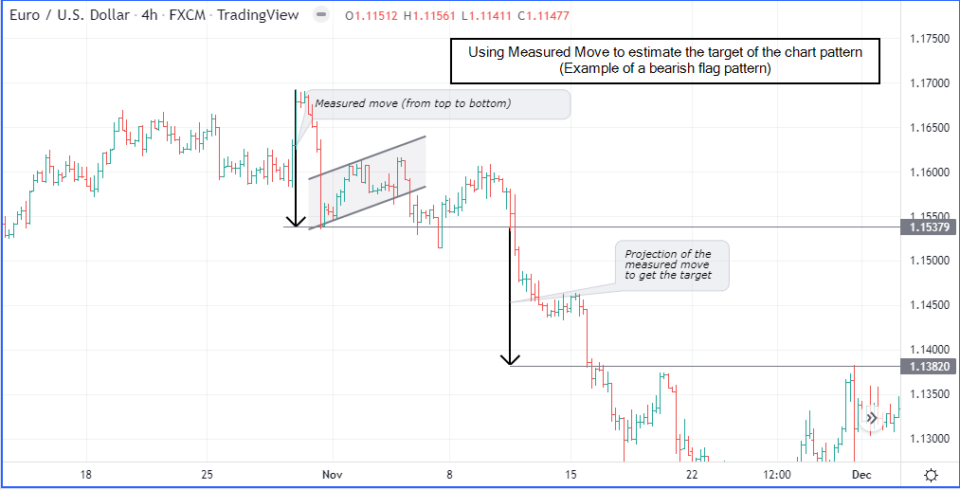
When trading a chart pattern, the first step is to calculate the measured move.
This is done by measuring the height of the chart pattern. Following this, the height is then measured in the opposite direction. This gives you the target area.
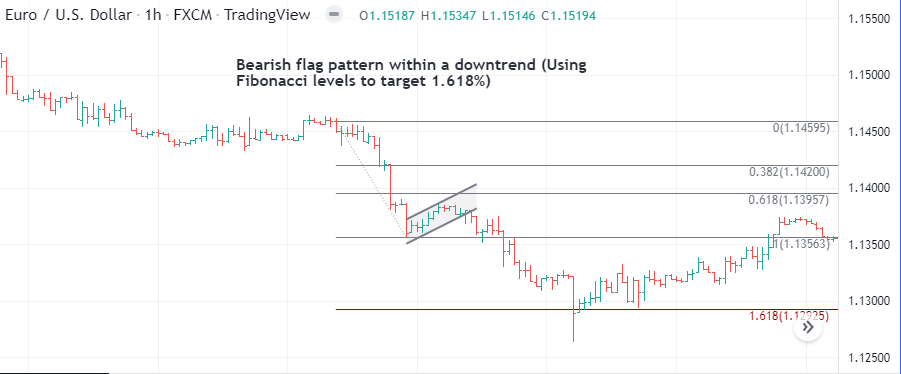
You can avoid these calculations, by simply using the MT4 Fibonacci tool. You can set the target levels of 0%, 100%, 161.8% (alongside other levels if you are interested), and 200%.
Since there are quite a few traders watching chart patterns, it is a good practice to use the 161.8% Fibonacci extension level as the target. This will help you to capture guaranteed profits.
The picture below shows how the measured move works.
No matter what chart pattern you are trading, the measured move concept remains the same.
Example of using chart patterns in trading
In this section, we will decipher how to use chart pattern in technical analysis and how you can spot potential trading opportunities.
Take some time to go through this chart pattern. On the top, we have the EURUSD daily chart and on the bottom, we have the EURUSD 4-hour chart.
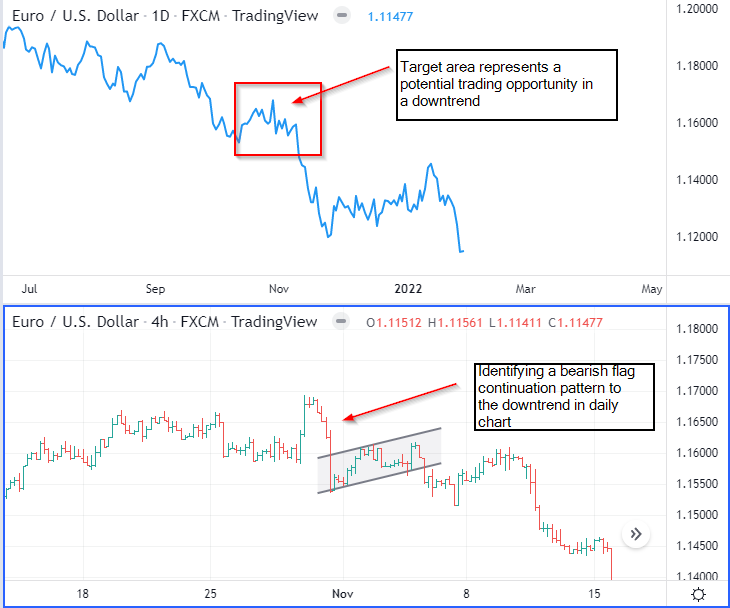
On the daily chart, we see evidence of a strong downtrend. Price initially drops to around 1.155 and makes a modest bounce to the upside.
Since this is in the middle of the trend, we can look at any possible chart pattern on the lower chart time frames. As such, we find that on the four-hour chart pattern, there is a bearish flag pattern that formed.
Using the measured move technique presented in the previous section, we can take a short position in EURUSD based on the 4-hour chart pattern signal.
Eventually, you can see that the price strongly moves in the expected direction.
In terms of entry, we place our short entry near the bottom of the measured move and project it lower, which becomes our target. The stop loss is set to the last pivot high formed inside the flag itself.
Thus, if the price reversed and rose back above this high, it would invalidate the short bias. Notice how price does indeed make a bounce. However, this bounce stops a few pips short of invalidating the bearish flag pattern.
The main takeaway from this is that any chart pattern will come with an invalidation level. This helps traders to maintain a good risk to reward ratio for that trade. Over time, this can add up as the target level is at least twice as much as the risk you put on to the trade.
The below five tips will you improve your chart pattern trading even better.
- Chart patterns are always easy to spot and explain in hindsight. That is, after the pattern formed. However, in real-time, trading chart patterns requires a lot of experience. On top of this, chart patterns are also subjective, especially if they are forming in real-time. As a result, traders should not fall into a false sense of security when trading chart patterns.
- The context where the chart pattern forms are always important. Since chart patterns can form on any timeframe, traders should understand the broader context. This will help them to decide if the chart pattern is indeed valid or not.
- The chart patterns you see in technical analysis are not always 100% fool-proof. Meaning that while a pattern is validated and price moves as expected, it may reverse direction mid-way. Traders should be aware of this anomaly and be prepared for such a price movement. Risk management plays an important role in this aspect.
- Instead of focusing on the full measured move, it always helps to set the target at 1.618% Fibonacci level. This greatly improves the odds of your chart pattern target being hit, most of the time. Still, as mentioned in point #3, the price can reverse mid-way. Hence, despite using a 1.618% conservative target, the risk of price reversal still remains.
- It is always a good practice to ensure that you take into account a what-if analysis as well. The what-if analysis looks at what could price do, if the chart pattern is invalidated. This approach will make you alert to price movements in both directions. It also helps you to manage your risks better.
Trading with chart patterns – Conclusion
Chart patterns in technical analysis are simply one of the many ways traders can utilize to spot trading opportunities.
One should not fall into the debate of whether chart patterns are better than other technical indicator-based trading systems.
In fact, using indicator-based technical analysis alongside chart patterns can improve your trading efficiency. In most cases, you will find a confluence between the indicator-based technical signals and the chart patterns.
But having said that, chart patterns are not risk-averse. Due to the subjectivity involved, traders should be alert when using such a strategy. The most important point to remember is that price action always comes first.
Therefore, even if a chart pattern became valid, it can still be invalidated, such as not meeting the price target. Therefore, traders should give first priority to price action rather than the pattern.
The chart pattern, after all, is a product of price action itself.
Despite being subjective, technical chart patterns are much easier to understand. While it takes time, traders can train their eyes to spot potential formations that occur.
This will help you to evaluate whether the chart pattern is valid or not.
As with any form of trading strategy, using validation from two different methods can help. Since chart patterns are complementary to your existing system, they can be used as an additional validation rule.
With good enough practice, chart patterns based trading can be very helpful for traders. Chart patterns are not dependent on the time-frame of your choice. Hence, chart pattern-based trading is suitable for both intraday traders as well as swing traders. If you are able to master just a few reversals and continuation chart patterns, this is more than enough to help improve your trading style.