
GBP/USD
- Resistance Zone: 142 to 142.5
- Support Zone: 140 to 139.5
- Next Support: 139
- Pivot: 141.10 to 140.30
Trade Insights
Possible Long positions above 141.10 with the target of 142.00. Alternatively, watch out for downside below 141 towards 140.30 and then re-enter for the long position.
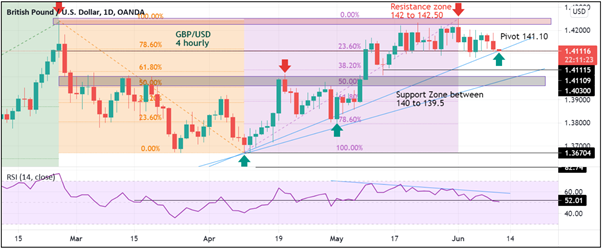
Chart Analysis:
Directional bias: 2 Weeks GBP/USD
Bullish Bias above: 141.00 – Break below 141 can trigger a further drop towards a crucial point on the chart to 140.30. However, it looks Pivot of 141.10 will hold the support and prices could move higher from here to test the resistance zone at 142 to 142.5. We see a possible long position at between 141.10 to 140.30.
Fundamental summary:
Chief Economist Andy Haldane, at Bank of England has mentioned that we could start tightening the tap on QE. This has alone moved the pound higher. As the Central bank will cut down on the Bond- Buying this will reduce printing of pounds and thus will boost the currency. However, Brexit is still haunting the pound along with worsening relations between the EU block and the UK on several fronts. On the other side, in America as consumers begin to feel the pinch of inflation the Federal Reserve could also tapper the bond buying boosting the dollar. So we are keeping a close eyes on the developments.
XAU/USD
- Resistance Zone: $1908 to $1912
- Key Support Level: $1881
- Next Support Level: $1865 to $1870
- Pivot: $1881
Trade Insight
Possible Long positions above $1881 with the target of $1993. If $1881 is broken, then on second confirmation candle Go Short. RSI is bearish but seems nearing inflection point.
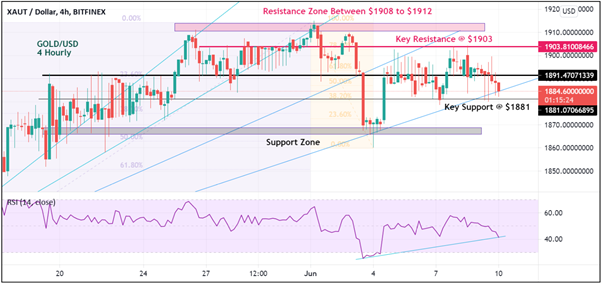
Chart Analysis:
Directional bias: 2 Weeks GOLD/USD
Gold hit its support zone around $1860 on 4th June before May Job Reports. However, after the release on Friday the Gold Spot prices began a sharp rally higher to hit the resistance at $1901 twice now. We are still Bullish on the Gold in the midterm. The chart shows that Gold is consolidating near or at the $1880 level. The support at $1880 looks strong. We see opportunities for long positions above $1880. The key resistance is now at $1903, and it is being tested as of the time of analysis. Once broken the Gold prices can move upwards to test the resistance zone between $1908 to $1912 which has proven quite difficult to break in the previous few attempts. It appears from the chart setup that this time Gold prices can break through the resistance zone.
Fundamental summary
Last Week’s release of the US May Jobs Report and the unemployment rate data suggested stability as the recovery continues in the American economy, but the numbers were a little below expectations. The data shows that it is quite unlikely that FOMC will provide any guidance in the July meeting for a move to tapper the ongoing massive asset purchase program and step into a phase of tightening the interest rates. As the US is entering into the slower summer months the main data point to forward is the updated assessment of Inflation via the CPI numbers. Plus, the infrastructure bill was a way of another burst of Fiscal Stimulus by the Biden administration.
USD/JPY
- Resistance Zone: 110.97 to 111.10
- Key Resistance Level: 110.97
- Support Cluster: 109.20
- Pivot: $109.60
Trade Insight
USD/JPY has been on the course of higher highs. Possible Long positions at current levels with the target of 110.97. The resistance at 110.97 will hold and here the prices could be pushed back a little before upward trend is resumed.
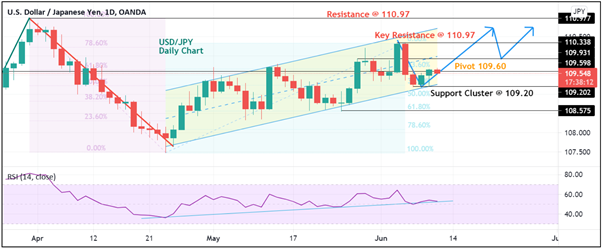
Chart Analysis:
Directional bias: 2 Weeks USD/JPY
USD/JPY is moving in an upward parallel channel since the month of May. The support Cluster and 109.20 within the Channel look strong and should hold in case of any downward movement. The USD dropped on Nonfarm Payrolls news and since then has recovered and now sitting at the Pivot point 109.60. The RSI is bullish and signaling further advances in the prices. After crossing mild resistance on its way up the USD should test the resistance at 110.97. This level could hold, and prices could be pushed back a little before the upward trend is resumed.
Fundamental summary
The main event of the week was Nonfarm Payrolls in the US and resulted in USD/JPY running downward in the first few hours of the news. Later the market realized the improvement in the numbers were not adequate to trigger Fed Policy change. The weaker labour market will keep the Fed on hold for the foreseeable future as they are focused more on job creation. Apparently, they don’t have the permission of the jobs market yet to change interest rates
