If you are an avid chart watcher in the financial markets, you may notice something unique that happens when looking at candlestick charts. Every now and then, you will come across empty space between one candlestick to another.
Generally, the closing price of the previous candlestick is the same as the opening price of the next candlestick. But this doesn't hold in some instances. Consequently, what you see are some gaps between the closing price and the opening price of two candlesticks.
These blank areas in the trading chart's candlesticks are what are known as gaps. Gap trading by itself is a unique trading strategy. Depending on what market you look at, the gaps may be more frequent. For example, gaps are not very common in the Forex CFD markets.
But on the other hand, gaps are very frequent when you analyse stocks. Why this discrepancy between the two asset classes? More importantly, how can you take advantage of the price gaps to build an effective trading strategy?
Although a gap trading strategy may look simple, if you do not understand the fundamentals behind the gap, there is a good chance that you will lose money. In this article, we give you insights into what are gaps and why they are formed.
Knowing this information is essential because it helps you to manage your risk more efficiently. Furthermore, you will also learn about something unique about gaps, which is the gaps based on timeframe. This is a feature that is unique to the forex currency pairs.
It will enable you to quickly scan through different currency pairs and prepare a trading strategy.
What is a gap in the price chart?
We will start at the very beginning. Learn what is a gap in a candlestick chart and the fundamentals behind the gap formation.
A gap in a price chart is defined as a blank or an empty space between the closing and opening prices of two candlesticks.
If you read closely, the keyword here is the candlestick chart. It is impossible to see the price gap in a line chart because it only plots the closing prices. Therefore, gaps can be seen only in a chart that plots the open and close.
This can be found in only two chart types, the bar chart and the candlestick chart. Due to the visual depiction between the bar chart and candlestick chart, it is more easy to spot price gaps in a candlestick chart.
To illustrate this point, look at the below two candlesticks and bar charts. In the area marked by the red ellipse, you can see that the previous candlestick closed at 159.22, and the next candlestick opens at 165.71.
This difference of $6.49 is what makes the price gap.
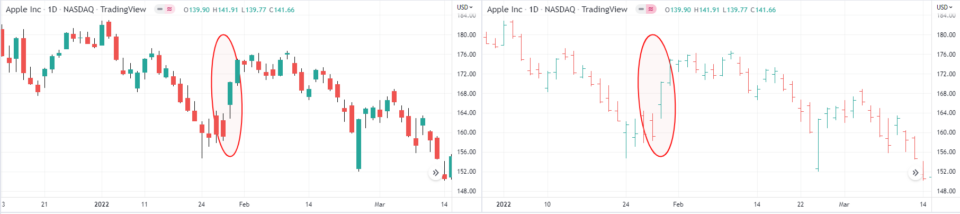
We picked this particular price gap, where you can see that it is a lot more convenient to spot gaps on the candlestick chart (left-hand chart) compared to the bar chart on the right.
However, gaps that form are the same in both the chart types. Thus, it is more of a personal choice rather than anything else. Many traders prefer candlestick charts for gap trading because it is a lot easier. But if you wish to use a bar chart, that is also acceptable.
Having clarified this, let’s look deeper into why gaps are formed.
Why are gaps formed?
There are a number of reasons why gaps form in the chart between the closing and opening price of two sessions.
One of the main reasons is to do with liquidity, or rather the lack of it. Typically, in a very liquid market, gaps are hard to form. This is because there are too many trades in the market. However, gaps form when there are not too many trades and the prices are quite far off.
This is why gaps are very common in penny stocks. Penny stocks are very illiquid and just one large order can move prices dramatically. To further understand the technicality of gaps, you would need to learn more about the order book and how orders are filled.
When it comes to the forex markets, which are OTC trades and usually trade round the clock, you now know why gaps in the forex markets are not very common. Yet, from time to time gaps may occur.
What is even more interesting is that the gaps are not uniform. In other words, depending on the broker you are trading with, the gap may or may not show. This is because different brokers use different liquidity providers.
Thus, depending on the market activity and the liquidity available, the gap that may occur in a EURUSD price chart with one broker, will not show up as a gap with another broker. The only exception to gaps is for exchange-traded assets.
Examples of this include futures or stocks, which are traded on an exchange. For such assets, no matter what asset you pick up and what broker you trade with, gaps will remain the same. This is because all the brokers fetch the market data from the exchange directly.
Types of gaps
A gap is called differently depending on where it occurs in the context of a trend. There are three main types of gaps.
- Breakout
- Continuation
- Exhaustion
What is a breakout gap?
A breakout gap occurs at the end of a consolidation phase. A consolidation phase is when prices are trading within a set price range. Broadly speaking, this consolidation phase can last from weeks to months, for it to qualify as a consolidation phase. It is more applicable and common to the equity markets.
Following this established range, price then gaps higher. This is what is called a breakout gap.
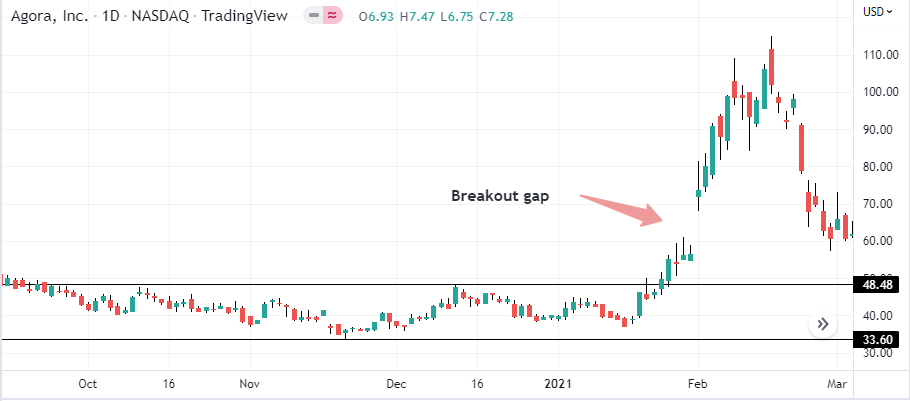
The above chart shows what a breakout gap looks like. Note that the breakout doesn’t necessarily appear near the breakout level but a few points outside the range. This breakout gap is a trigger for investors to take a long position on the stock.
Sometimes, the breakout gap can appear right inside or very close to the sideways range. A breakout gap can be bullish or bearish, depending on where the sideways range forms. In the above example, after a prolonged decline, the price breaks out from the range to the upside.
But a breakout gap can also occur if it appears at the end of a rally when prices settle into a range. In such cases, the breakout gap forms with prices gapping to the downside. Here, it would trigger a sell signal for investors.
What is a continuation gap?
A continuation gap as the name suggests tends to occur within a trend. The key is to catch the continuation gap as early as possible. There can be one or more continuation gaps. A continuation gap generally indicates that there is more room for the stock price to rally. Of course, one needs to look at this in context. Just blindly looking for a gap and qualifying it as a continuation gap will not help.
In the chart below, you can see how prices were gradually building up a short-term uptrend. You can see the occurrence of a continuation gap here. It is important to point out that the continuation gap is an upside gap.
This is valid enough confirmation that the stock price will, to some level of confidence move to the upside. Combined with other fundamental and technical confirmation, investors can then take a long position in such a stock.
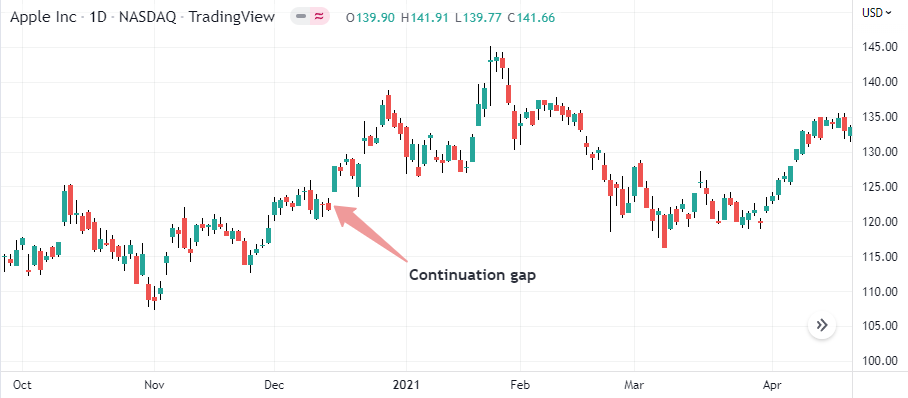
If there is for example a downside gap formed within a continuation gap, you should be aware. It can be an early warning that the stock prices are likely to reverse direction.
The continuation gap can occur in both a bull and bear market. Therefore, this is a neutral signal and the direction it conveys should be analysed based on the general market trend.
What is an exhaustion gap?
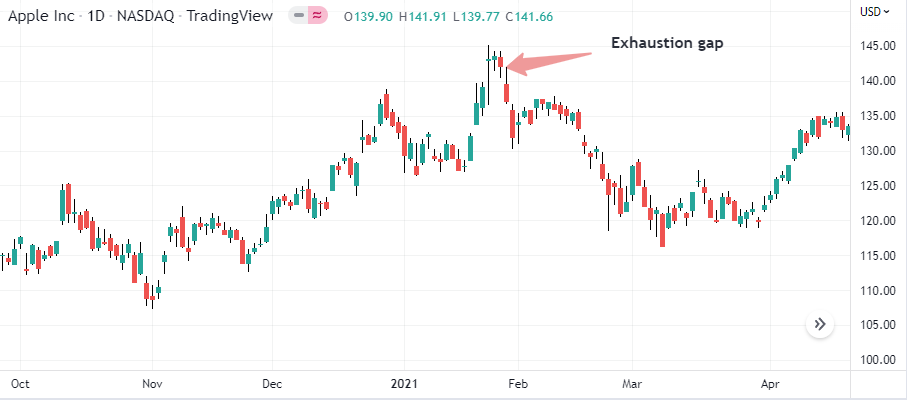
An exhaustion gap is formed toward the end of a rally, or toward the end of a bear market. This is the last and final push that investors make before booking profits.
In the chart below, you can see an exhaustion gap occurring twice. First, on the left side, there is an exhaustion gap formed, followed by a Doji candlestick. Two sessions later, we see a downside gap, which also qualifies as an exhaustion gap.
It should be noted that prices do not move as smoothly as in the below example. Sometimes, instead of a change in direction of the trend, prices can move into a consolidation phase. Therefore, exhaustion gaps are important as it helps investors to book profits, rather than have their trades locked up as one wouldn’t know if prices will consolidate or not.
In all of the above examples shown, gaps are quite important to understand the market sentiment behind the price. Prices are after all a reflection of the investors and the market. Thus, they can convey a lot of information.
Gap trading is more suitable for long-term investors who primarily enter the market on fundamentals and then look to the technology to manage their trades more efficiently.
Gaps in the forex markets
In the forex markets, gaps are not as common as with stocks. However, gaps have a higher probability of occurring on a Monday, when the markets open after the weekend. This is when you will see gaps forming, but again it is subject to the broker.
Gaps are evident when looking at the 15-minute or even the 5-minute chart time frame when it comes to the forex markets. If you look at the 1-hour or higher timeframes, the gaps are not visible at all.
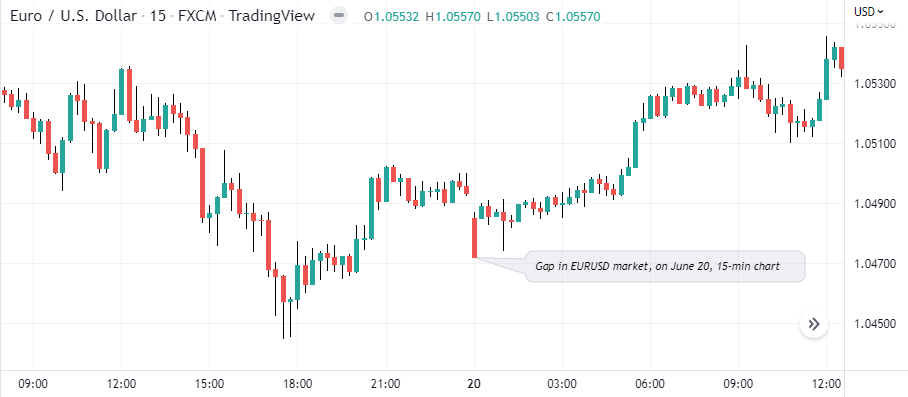
In the above chart, we can clearly see a gap forming in the EURUSD candlestick chart on the 15-minute time frame. Note that this gap is visible only on the 15-minute and 30-minute chart and more importantly it occurs on June 20, which happens to be a Monday.
This is quite reasonable given that the markets open after the weekend. If you notice the session too, it occurs in the first opening session after which there are no clear gaps to spot.
There is a common saying that gaps are meant to be filled.
What this means is that price often returns back to fill the gap. It can either happen immediately, or it can takes days, weeks or even months for the gap to be filled.
Following up on the same chart, when we now switch to the 30-minute chart time frame, you can see that the gap was very quickly filled via a low, three days later.
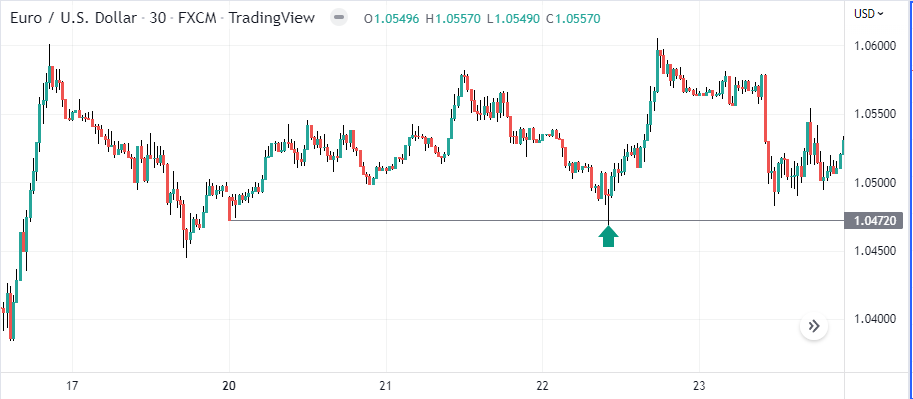
What is evident from the above chart and the main takeaway being that gaps tend to act as support and resistance levels.
Using gaps as a trading strategy
And this is where traders can utilize gaps to fine-tune or build a gap based trading strategy. But it is not straightforward, because sometimes gaps can fail too. Therefore, additional confirmation such as trend analysis and other indicator signals should also be considered.
Depending on what markets you are trading, the gap trading strategy can be customized. For example, when trading stock CFDs, such as AAPL, AMZN, etc, gaps can be used to identify the possible direction of the markets.
This can allow for some long-term swing trading opportunities. On the other hand, if you are analysing gaps in the forex markets, then you could use the gaps as possible support and resistance levels.
Following this, you can then use other indicators to validate the trades.
In conclusion, gaps are quite easy to read and one of the simplest ways to ascertain the trend in the markets. Investors and traders alike can utilize this information in order to trade the markets accordingly.
However, a word of caution that gaps, especially in the forex markets are not uniform across brokers. Therefore, your analysis is quite likely to be limited to just your broker, since the gaps may not be visible when using the prices from another broker.