XBT/USD – Consolidation over?
- Resistance Zone: $51000 to $52000
- Key Resistance: $44700
- Major Pivot Point: $40700
- Key Support Level: $37500
- Support Zone: $34300 to $33300
- Last Analysis Date: Blue Vertical Line
- 200 Day SMA – Green Line
- 50 Day SMA – Red Line
- CBOE VIX – Volatility Index @ 22.94 -0.59 (-2.51%)
Trade Insights
XBT/USD Pair – Chart shows viable long positions above the Pivot point at $40700, with the first target of the Key Resistance level at $44700 and then the test of Resistance zone at $51000 to $52000.
Alternatively, Short positions below the Pivot Point of $40700 to first test the Key Support level at $37500 and then with any further weakness target the of Support Zone between $34300 to $33300 (Tradingview).
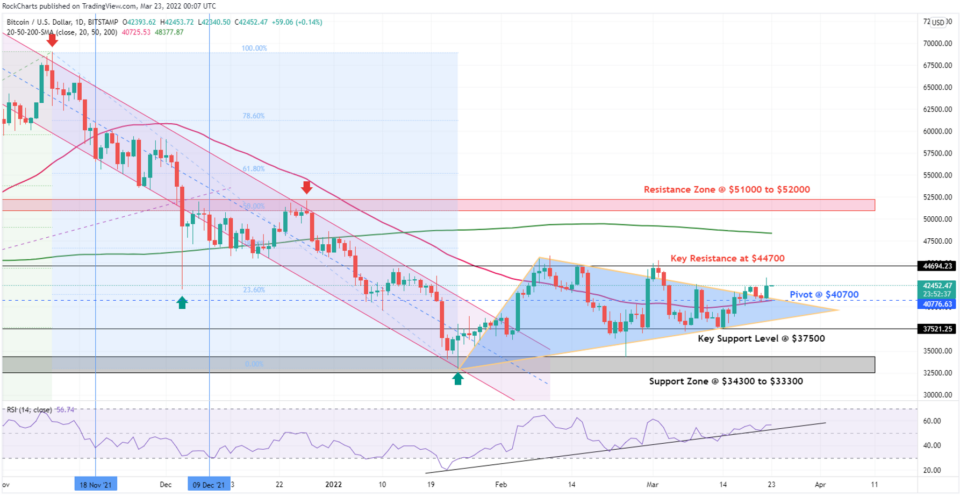
Chart Analysis:
Directional bias: 2 XBT/USD
XBT/USD chart shows that Bitcoin has been consolidating above the Key Support Level at $37500. Prices have been moving sideways between the parallel zone between support and resistance level on the chart for a while now. In this analysis, we see that the Support and Resistance levels have moved higher and the Pivot point has shifted upwards to $40700.
Bitcoin prices have set up three equal highs and 4 higher lows since January. The dilemma seems to be over for Bitcoin as there is the possibility of forming another high above $44000 and prices could move upward to find a higher high at $51000 Resistance zone after this. Once this level is reached then after forming another higher low, we could see a test of $60000 psychological level and the prices could move beyond.
The RSI Indicator shows that the prices are moving upwards towards 60 points and a further push is possible. The 50-day SMA red line is turning upwards and the 200-day SMA green line is taking a slight downturn. We could see a cross of SMA lines in a month, and this suggests a rally in the price action in the near future.
Fundamental Overview: UK advertising authority has issued crypto ads notice to 50 firms instructing them to monitor the ads for compliance and warned there will be clampdowns on misleading cryptocurrency ads in the country. On the other hand, US Treasury officials have made an observation that the cryptocurrency could not be used in a large-scale way to evade sanctions. Both the developments are giving more strength to the case of the Digital currency and could further boost investor confidence.
See more about market insight this week: Market Insight – S&P 500 Recovery! Higher Rates Over Higher Inflation!