Using technical indicators in forex is a key step a forex trader should master.
When it comes to day trading, the direction of the matter of the price. Traders make use of price charts to interpret the price action. Technical indicators help traders to understand what the market is doing.
Depending on the combination of technical indicators used, one can derive different trading strategies. However, in many cases, traders do not pay much attention to the type of indicators they use.
This leads to trading strategies that do not work as expected. Even worse, in many cases, there are numerous examples of how traders overload their trading strategies. Traders end up using too many indicators on their charts.
This is done in hopes that the forex trading strategy is more robust.
But this is far from the truth! Too many indicators in your forex trading strategy can lead to multiple trading signals. The consistency is lost, and the traders end up being confused about what signals to take.
This guide to using technical indicators in forex outlines the main types of indicators that are available. We will also outline the purpose of the different indicators.
The information in this guide will enable you to understand what the indicator measures and how you can use this for day trading forex.
What are technical indicators in forex?
Technical indicators, as the name suggests are indicators that allow traders to interpret the price chart. Using technical indicators, day traders in forex can measure various aspects of the currency pairs.
Technical indicators are merely mathematically driven components. They make use of the common variables such as the open, high, low, or closing prices. In some cases, other aspects such as volume and duration also form the basis.
Indicators in forex help the day trader to decide which way the market was moving. They do not predict future price movements. But this is where technical analysis comes into play.
As you know, technical analysis is the study of past price history to predict future price movements.
In this aspect, technical indicators allow traders to understand how prices are behaving. It helps traders to understand what the market was doing, which direction it was moving in, and so on.
What are the different types of technical indicators?
There are many technical indicators available these days. But no matter what technical indicator you use, they belong to one of the following categories.
Trend indicators
Trend indicators are a category of technical indicators in the markets which depict the direction of the price.
As the name suggests, these indicators measure the trends of the instrument or the currency pair.
The trend is defined as the tendency of prices to move in a particular direction for a period. There are two types of trends.
- Uptrend
- Downtrend
An uptrend is where the prices continuously move in an upward direction. This indicates that there is a healthy demand for the underlying security or currency pair. Prices continue to rise over a period, suggesting that the market is in an uptrend.
A downtrend is where prices tend to move in a downward direction. The downtrend indicators a healthy supply in the currency pair. In a downtrend, prices tend to continuously fall over a period.
Depending on the period or duration in question, the trends are defined accordingly.
Trends were popularized in the early 1900s when Charles Dow wrote about them. It is now famously known as the Dow Theory.
In summary: Trend indicators display the direction in which a security is moving
Momentum indicators
Momentum indicators, as the name suggests measures the momentum in the underlying security or forex pairs. Momentum is the rate of change in the price of the currency pair.
Momentum indicators measure how fast prices are rising or falling.
By deriving some concepts of physics, momentum in the financial markets also follow some basic principles.
For example, a forex price that is rising rapidly will continue to do so until the momentum or rate of change beings to slow. It is only after this momentum slows; can one expect to see prices reversing direction.
When you combine momentum and trend, traders are able to predict the future price action.
In summary: Momentum indicators measure the rate of change or acceleration in the security’s price
Volatility indicators
Volatility in the financial markets is a statistical measure. In some ways, volatility might look similar to a momentum indicator.
However, volatility measures the rate of change of the security in both directions.
To derive volatility, the security’s mean price forms the basis. This means is taken over a certain period. From this mean, volatility measures how far prices have deviated from the mean price.
Volatility can help traders to understand the security or the currency pair’s behavior.
Although the term volatility is used in many cases, it refers only to historical volatility. This is a measure of the historical changes of the currency pair.
In summary: Volatility is a statistical measure that tells you how far price has moved from its mean
What are the most popular trend indicators?
There are different trend indicators available for forex traders. The choice of which trend indicator you use depends entirely on you.
Although the trend indicators may look different, they form the basis for depicting the direction in prices.
The most commonly used trend indicators are:
- Moving averages
- Average Directional index (ADX)
- Parabolic Stop and Reverse (PSAR)
- Ichimoku Kinko Hyo
- Envelopes or channel indicators
No matter which of the above indicators you use, they convey the same information for the trader. The way the trend information is depicted may of course differ.
It will depend on the type of indicator that you use.
How are trends formed in the forex markets?
Trends take time to evolve and to be established. According to Charles Dow, there are three types of trends.
- The primary trend
- The secondary trend
- The minor trend
Each of these different trends can span from a few years, or a few months, or a couple of weeks.
Trends in the forex markets are formed when there is a continued demand for the currency pair. The constant demand for the currency pair will ensure that prices rise continuously or vice versa.
On the price chart, you will notice that during an uptrend, prices make consistently higher highs and higher lows. Similarly, in a downtrend, prices make consistently lower highs and lower lows.
You can also view trends without having to make use of any indicators but only price action.
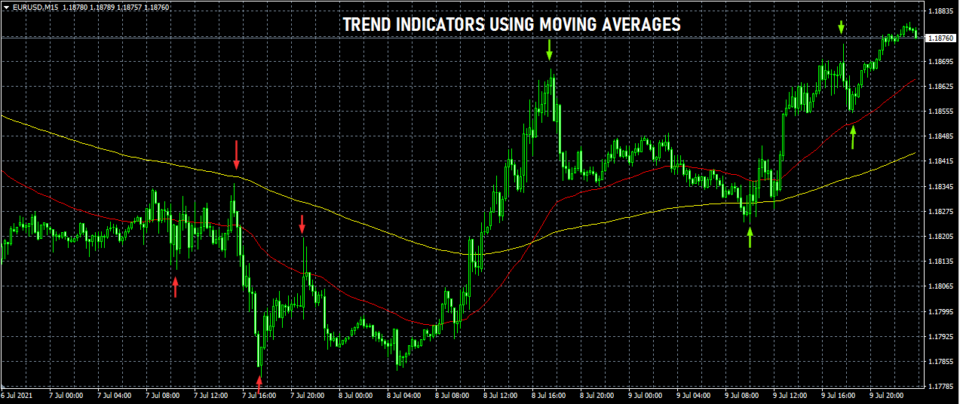
In the above chart, we can see an example of how two moving averages can measure the trend. The yellow moving average line measures the average price for the past 200 sessions. The red line measures the average prices for the last 50 periods.
When the short-term moving average cuts across and stays above the long-term moving average, it signals an uptrend. Similarly, when the short-term moving average cuts below and remains below the long-term moving average it signals a downtrend.
You can also see the price highs, and lows marked by the red and green arrows. It shows how price itself can signal the uptrend or a downtrend.
Trend indicators are often plotted on the price chart. The exception is the Average Directional Index or the ADX.
What are the most popular momentum indicators?
Momentum indicators measure the rate of change. They are ideally used in conjunction with a trend indicator.
Using momentum indicators, traders are able to understand if the price change or acceleration is rising or falling steadily.
The most used momentum indicators are:
- Stochastics oscillator
- Relative strength index
- Rate of change
- Moving Average Convergence Divergence (MACD)
- Commodity channel index
You may notice that indicators that belong to the momentum category are often referred to as oscillators.
Oscillators in technical analysis are indicators that plot the rate of change in a sub-chart or a sub-window. Another unique feature of momentum indicators is that they move around fixed values.
These fixed values or levels can be either 0 and 100, or -100 to +100. The mainline or the zero-line acts as the basis.
When the momentum indicator rises above the zero lines, it suggests that the momentum or acceleration is picking up.
Likewise, when the momentum indicator falls below the zero lines it depicts faster acceleration in prices but to the downside.
In technical terms, these levels are also known as overbought or oversold levels of OBOS.
The overbought and oversold levels are when prices rise above or remain close to the fixed values.
Forex traders make use of the momentum indicators to understand if the price will continue in the same direction as it was moving or not.
Typically, trends tend to change after momentum slows.
How does momentum precede trend change?
In order for any object to change direction, it needs to first slow down. This can happen when the price is in a strong uptrend. But as more and more sellers enter the market, the rate of change in the momentum will slow.
Eventually, there comes a point when the sellers overwhelm the buyers. This can lead to the previous momentum coming to a halt. Finally, price starts to move in the opposite direction.
Momentum indicators allow traders to understand these price changes. Trading signals are generated when the momentum starts to slow. When combining momentum with trends, traders can get a sound view of what the markets will do next.
The next chart below gives an example of a momentum indicator such as the Commodity Channel Index or the CCI.
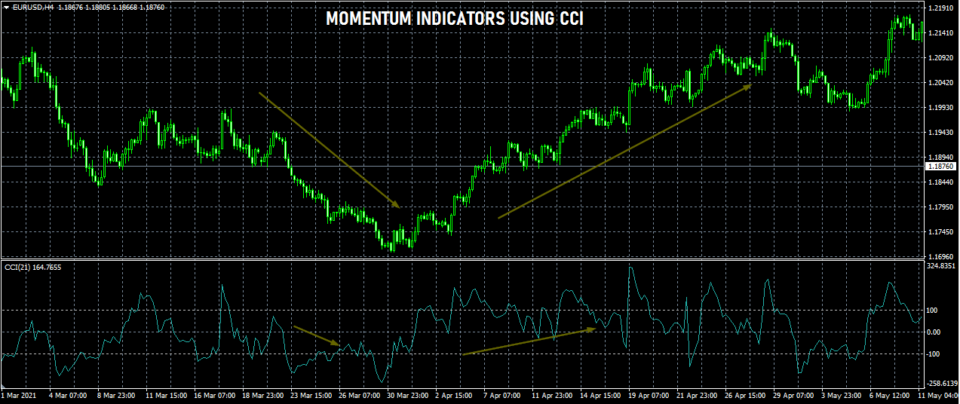
In this chart, we can see two instances of rising and falling prices.
From the left, when price beings to move lower, the commodity channel index or the CCI also starts to move below the zero-line.
This indicates that the momentum or the rate of change in prices is high but to the downside.
Similarly, you can see how the price trend changes and starts to move higher. This is depicted by the CCI indicator now consistently staying above the zero-line. It suggests that the price trend is to the upside.
You can notice how momentum slows before the price starts to change its direction.
What are the most popular volatility indicators?
Volatility indicators may sound similar to momentum indicators visually. However, the main difference is how the indicators are used.
Volatility indicators can be plotted on the price chart, or even on the sub-chart.
The unique feature of volatility indicators is that they do not depict direction. The volatility indicators merely tell the traders how far the currency price can deviate from its mean price.
As mentioned earlier, volatility indicators need the mean prices to measure volatility.
Some of the popular volatility indicators in forex are:
- Bollinger bands
- Standard deviation channel
- Keltner channel
- Average True Range (ATR)
- Donchian channels
You may notice that most of the indicators in the volatility category are channels.
This is because the channels plot the upper and lower deviation levels. But as mentioned, they do not depict the direction of the prices.
Among the different volatility indicators, the Bollinger bands are the most popular of all. Almost all other volatility indicators behave in the same way.
A key aspect of volatility in the forex markets is that it comes in phases. There are periods of high volatility followed by periods of low volatility.
This change in volatility allows traders to understand whether prices will move faster or slower. We should mention that the duration of these phases may vary.
How can you use volatility indicators in forex?
Volatility indicators are the favorite indicators for traders who prefer breakout trading strategies.
As the name suggests, breakout strategy is where prices break following a period of low volatility or consolidation.
This rapid change (depicted by rising volatility) can yield quick results.
The chart below shows how Bollinger bands depict the two volatility phases.
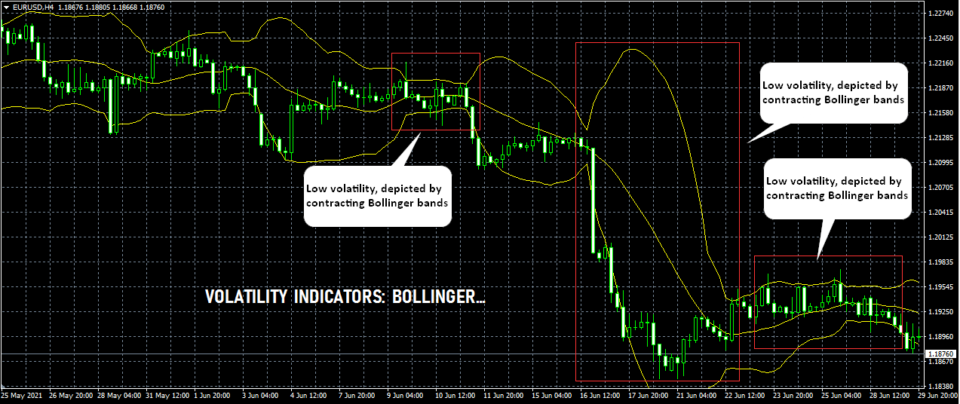
In the above chart, we use the Bollinger bands. For volatility indicators to work, they need to reference the mean price. Thus, you will always find the mean period settings.
For the above Bollinger band volatility indicator, we use a mean period of 20. This means that the mean price of the past 20 periods is calculated. This is shown by the middle line which is nothing but the 20-period moving average.
The lines above and below this mean price are the upper and lower standard deviations (+2 and -2).
When volatility slows, the Bollinger bands also contract. The upper and lower bands contract or tighten. This is when price also moves in a sideways range without making any new highs or lows.
Following this low volatility period, we have a sudden rise in volatility. This is signaled by the rapid change in prices (to the downside). You can see how the Bollinger bands now expand or widen.
How to use technical indicators in forex?
Learning about the three main types of indicators, the obvious question that comes to mind is how to use them.
You may have been using all if not most of these indicators already in your trading strategies. However, blindly adding a random combination of these indicators will not make the cut.
For a forex trading strategy to work, you will need to understand the indicator that you are using. The first step of course is in learning what category the indicator belongs to.
In general, there are three ways of trading.
- Trend trading
- Counter-trend trading
- Breakout trading
Each of these different trading styles will require a custom combination of indicators to work.
The main rule of thumb is to ensure that you do not overwhelm the charts with too many indicators.
Using too many indicators will not only confuse you but can also lead to a losing trading strategy. Choosing the right combination of indicators matter to depend on your trading style.
In conclusion, the following tips should ensure that you get a head start when using technical indicators in forex trading.
Three tips to use forex technical indicators more effectively
Tip #1: Do not make use of redundant indicators
Although trading indicators go by different names, they will almost always fall into one of the three main types of technical indicators. Hence, using different indicators that basically measure the trend, or volatility or momentum makes them redundant.
You may be tricked into believing that one indicator gives a different view of the markets, but that is wrong.
For example, it is not recommended to use a Stochastics oscillator alongside the Relative Strength Index or the RSI indicator. Both these indicators basically convey the same information about the momentum in the markets.
Tip #2: Understand how to trade
Having a good foundation on your trading style is a great way to filter out the various indicators. If you are using any of the three main types of trading, then you can automatically exclude quite a few indicators.
For example, if you were trend trading, then use a trend-following indicator with a momentum indicator or with a volatility indicator.
Combining all three indicator types will not give you much of a market context. By combining the momentum indicator with the volatility indicator, you will get confusing signals from the market.
Tip #3: Keep your charts clean
There is no hard and fast rule on how many technical indicators you want to use in your technical analysis. But at the same time, do not use too many indicators that price becomes secondary.
It is important to keep your price chart clean and limit the technical indicators to the minimum. At the same time, the choice of technical indicators should depict the information you are looking for.
This will help you to make clear trading decisions on whether to buy or sell.