S&P 500 attractive opportunity, Risk to economy visible?

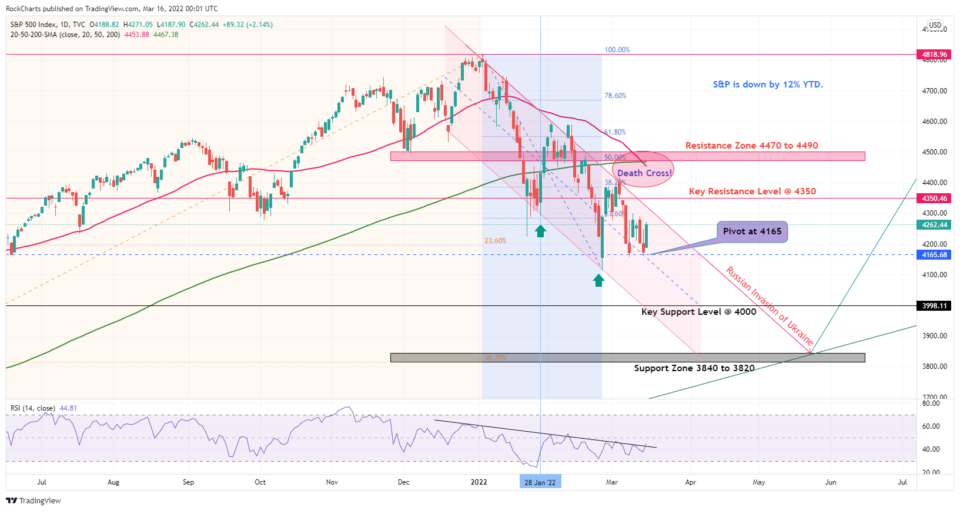
S&P 500 is down from the peak of 4818 to 4262 about 12% down for the year. And the index has already hit the Death cross on Monday as the SMA 50 has fallen below the 200 levels. It is yet to be seen if this Death cross would turn into a big sell-off and an eventual bear market. The market feels quite bleak in such an event. But it presents a good opportunity for investors to invest in cheap but high-quality stocks.
It has been noticed in the past that S&P500 produces gains in a 12-month period following a death cross. Historically, the average growth in a 12-month period is about 6.3%. It is based on the 53 times the index has closed in death cross territory as per the DJIA Data. If it all turns out into a full-fledged recession, then losses are inevitable. As it happened in 2007 when the market fell by 41.5% after entering into the death cross.
The risk to the economy is quite visible now as factors like inflation, geopolitical risks, higher commodity prices, rising interest rates, increased volatility, and the Russia-Ukraine war. These factors are all emerging together with the existing global pandemic. This could present an attractive opportunity for the longer-term investors.
At the close in NYSE, the Dow Jones (DJIA) climbed up by 1.82%, S&P 500 jumped up by 2.14% and the NASDAQ composite index was up by 2.92%. The CBOE Volatility Index has dropped down to just under 30 points now.
Click here to learn how to read charts.
Oil prices dropped further and are now back under $100!
USO/USD
Crude oil is down by 30% after hitting the peak of $129 a barrel on 7th March. Now it has retreated further below $100 a barrel. A few reasons behind the selloff in oil are the Covid Lockdowns in China. This may reduce the demand. Additionally, Iran the nuclear talks could resume increasing the possibility of more oil supply. Most of the geopolitical war premium on Oil from the Russia-Ukraine conflict has been lost in this highly volatile market. On the other hand, Saudi Arabia is discussing selling oil to China in Yuan due to increased dissatisfaction with the US govt policies.
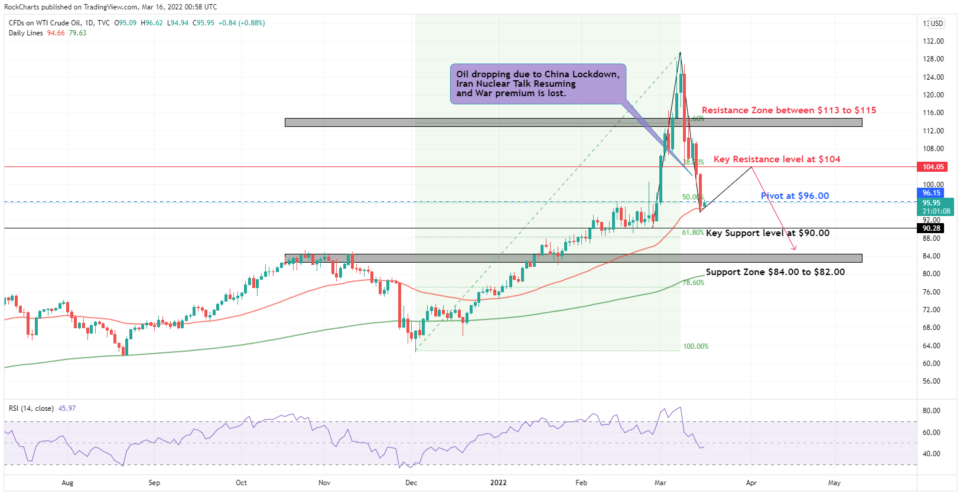
The chart shows that the oil prices have been dropping since they touch the $129 mark. The drop has been sharp, and oil has declined by $29 now. The chart shows that the prices are recovering after dropping under $100 and are just now trading at the Pivot at $96.00.
There could be opportunities for long trades above the Pivot point as Oil could recover from here. The first target insight is $104 the key resistance level. Then the Resistance Zone between $113 to $115 could be of interest. RSI has not dropped below 50 levels now. And it could be a good buying opportunity if it slips towards 30 points. This would mean short positions under $96 to first test the Key support level at $90.00. Then the next support zone at $84.00 to $82.00.
See Technical Analysis for the week: XAU/USD – Gold bubble burst!