What is the US dollar index (DXY)?
The US dollar index is a currency index, which essentially measures the strength of the US dollar against a basket of currencies. The US dollar index is also known as the dollar index or the DXY, or USDX. It is a trade-weighted index that is widely used by market participants.
Retail forex traders also look to the USDX as a way to assess the strength or weakness of the world’s leading currency.
If you are trading currencies in the forex markets, then you already know that most of the majors are paired against the US dollar. Examples include EURUSD, USDCAD, USDCHF, and so on. Thus, when trading such currency pairs, retail traders also study the price chart of the dollar index to see how it is performing.
The dollar index came into existence after the Bretton Woods agreement ended in 1973. It started with a base value of 100.
Below is an example of the US dollar index chart.
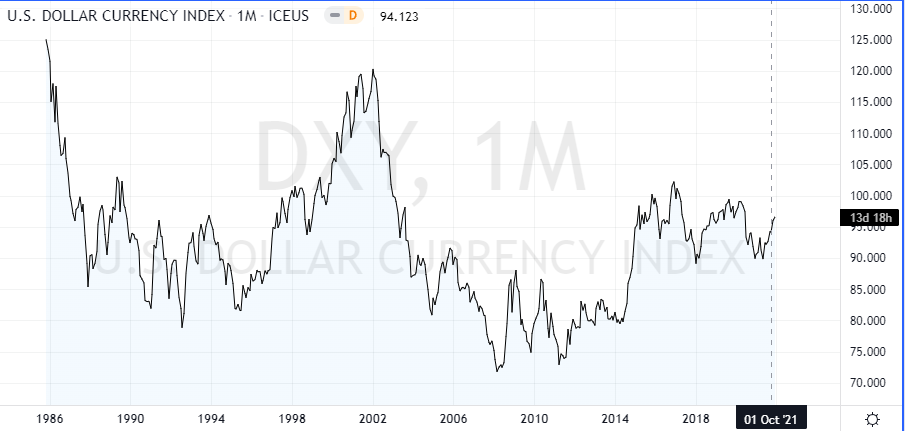
As you can see from the chart, the dollar index price chart looks similar to any other financial instrument. And this is indeed true.
The dollar index has its own volatility and traders can conduct their technical analysis study on this chart. The information that one gathers from this study can be applied to trade USD-based currency pairs.
However, as you will learn further along with this article, the different currencies that make up the dollar index have different weights. `Therefore, the way the USD behaves against the Euro for example can differ compared to the Japanese yen.
For traders, following the US dollar index price action can be important. It can give some additional insights that you would not see if you only followed the currency pair’s price action.
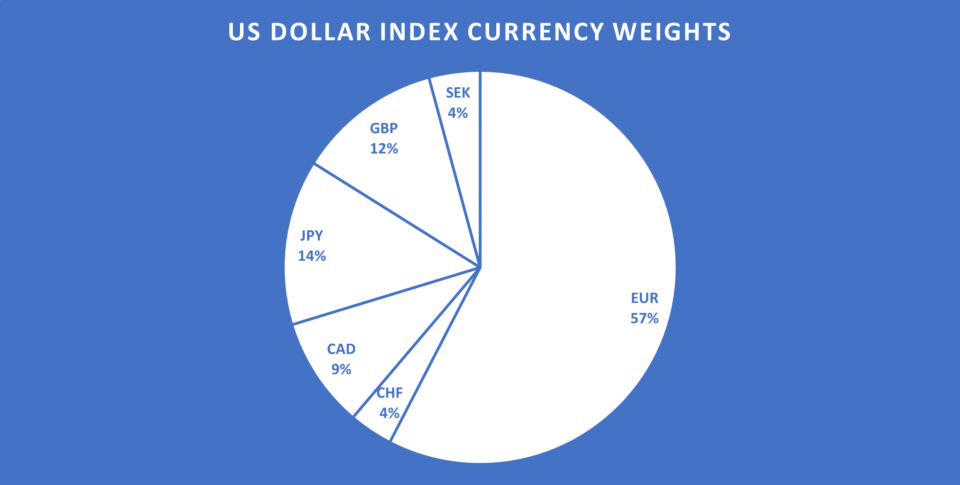
As you can see from the above chart, the Euro makes up the largest share of the index. This is indeed true considering that the euro is the second largest traded currency in the world. Furthermore, it is a common currency of the European Union. Hence, it is apt for the Euro to take the first spot.
The Japanese yen comes in at the second spot with a 14% share of the index. Since the JPY (along with the CHF) are safe-haven currencies, you will always see a strong negative correlation when comparing the safe-haven currencies to the dollar.
The British pound takes up the third spot with a 12% share on the index. The GBP is one of the oldest currencies in the world. At the same time, the UK’s economy is also one of the strongest and the largest, leading to the GBP at 12% in the index.
The composition of the US dollar index has not changed in the past decades. The dollar index is currently maintained by ICE (Intercontinental Exchange) which also has registered the name ‘US Dollar Index.’ Since its inception, the dollar index rose to the highest level of 164 in 1985. It fell to the lowest level of 70.79 in 2008, during the global financial crisis.
Understanding the US dollar index (DXY)
There are many synthetic versions of the Dollar index, available today. However, almost all of these are a copy of the ICE US dollar index.
Traders look to the dollar index for clues on how the dollar will behave.
Correlations between USD based currency pairs
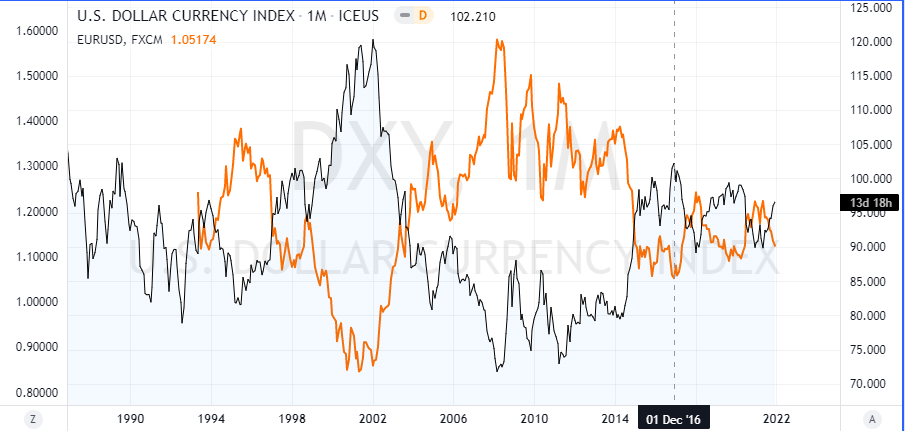
In the above chart, you can see the EURUSD (orange line) overlaid on the dollar index chart. Do you notice the negative correlation that exists here?
When the dollar rises, the EURUSD falls, and vice versa. This is a common phenomenon, especially for all currency pairs where the USD is the quote currency.
On the other hand, if you see currency pairs where the USD is the base currency, ex: USDCAD, USDJPY, USDCHF, you will see a positive correlation between the two.
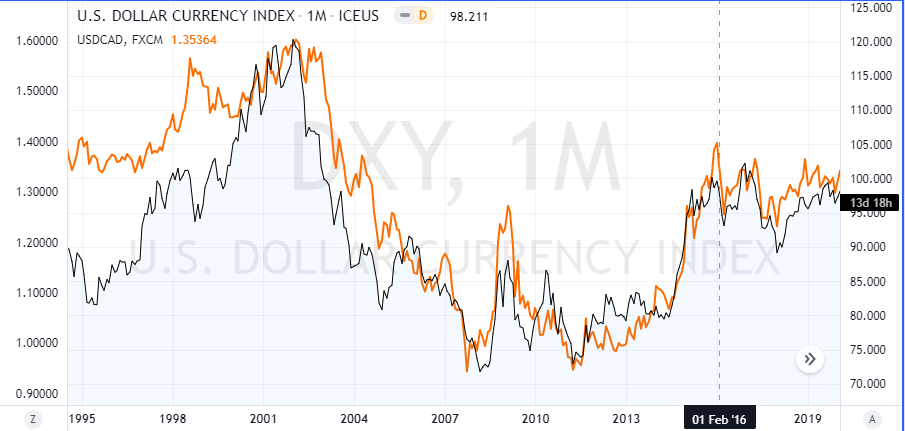
You can see how the peaks and the troughs nearly align themselves when comparing DXY to the USDCAD. If you observe the above USDCAD vs. Dollar index change, you will notice that the movement is not 1:1.
This is where the weightage of the currency plays an important role. The Canadian dollar is the fourth currency in the index.
It has a weight of 9%. Thus, the comparison of price action will not be as much as compared to the euro movements. Therefore, one of the quickest takeaways is that you can use DXY as a proxy for additional study when trading the EURUSD. Many a time, choppy price action in the EURUSD will not leave much room for any analysis.
But when you bring the dollar index into the picture, it can throw extra insights. One of the benefits of the dollar index is that you can apply the same technical analysis study on the chart. This includes indicators like moving averages, Fibonacci retracements, and so on.
Trading strategies you can use for the US dollar index (DXY)
The dollar index is available as a futures financial product. This is available from the ICE exchange. The availability of the USD futures means that there is also a dollar index CFDs.
But not all brokers offer the dollar index as a tradable CFD.
Still, charting platforms such as tradingview allow you to use the ICE dollar index for technical analysis study.
There are many different approaches to using DXY in your technical analysis study. We outline a few of such methods here.
This method includes using both price action techniques as well as technical indicators. The simplest way is to look at the monthly candlestick charts for both the EURUSD and the dollar index.
In the example below, you can see how DXY formed a double bottom and broke out of it around September 2021.
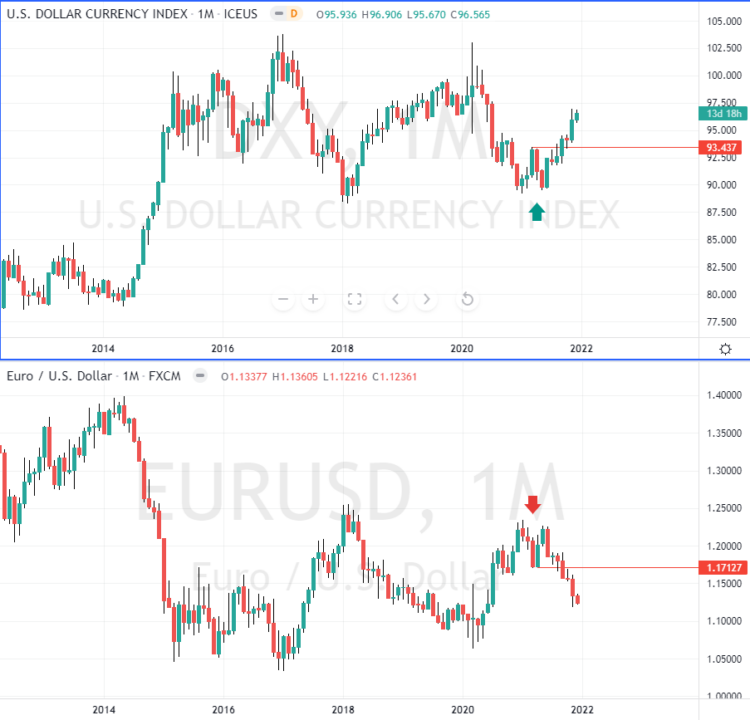
This also coincides with the EURUSD forming a double top pattern. As a result, a breakout from this pattern results in the dollar rising higher while the euro falls. Simply based on this knowledge, traders will know that the long-term trend in the EURUSD is to the downside.
From here on, you can continue your analysis on the EURUSD alone and apply your own trading strategies. In the short-term charts, you may find pullbacks that occur.
This can be a great way to trade into the trend and add to your short positions. The above chart also tells us that the US dollar index is nearing a key resistance level. The double bottom pattern gives an upside target of 97. Around these levels, we see the previous high forming. Thus, we can already conclude that the dollar rally may pause. This could lead to the euro attempting to regain some of its losses.
Applying the same technical studies on USDX (DXY) and the EURUSD
Another way of using DXY is to apply the same technical studies you use on the EURUSD.
What you will see as a result of this is an exact opposite movement.
Despite this commonality, you will see that the day-to-day price action can differ. Thus, when the EURUSD is moving sideways, there is a good chance for DXY to reveal something else. Most traders tend to trade on the EURUSD because of its liquidity. Hence, DXY is a great addition that can complement your existing strategies.
One can also extend these methods to analyze other currency pairs. But as we illustrated above, the weightage of the currency is not as strong as the euro. Hence, you may get to see some lag between the price action on the dollar index and the other currency pair.
Another fact worth mentioning is that the ICE US Dollar index is a futures product. Hence, it falls into the category of currency futures. This means that the dollar index positioning data is also available. The US. CFTC (Commodities and Futures Trade Commission) releases a weekly report on all futures instruments.
This includes the USDX as well. The CoT or the commitment of traders report will show how large institutions are positioned. An extreme bullish or bearish positioning in the dollar index often leads to a change in the trend. Hence, reading the CoT report once a week can give you the context of what is happening with the USD.
The report is available here. It shows the overall positions across the different currency futures.
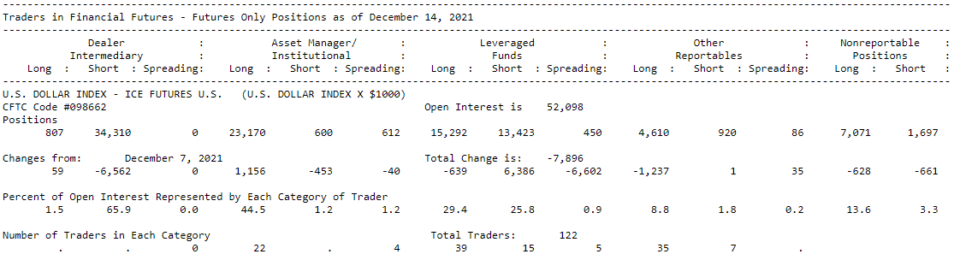
The above chart shows a snapshot of the US Dollar index – ICE Futures, from the CFTC’s weekly CoT Report.
Other dollar index products
Constructing an index is not a complicated process.
In fact, there are quite a few brokers who offer forex who also provide their own currency index. Thus, what we have today are different variations of the dollar index.
Some brokers even provide the currency index for different currencies. But among the many dollar index variations available, the most popular is the ICE Futures Dollar Index. Next to this is the Bloomberg Dollar Index.
You can see the details of this index here, including the price chart from Bloomberg.
FXCM, another big broker who offers forex also offers its own version, which is called the Dow Jones FXCM Dollar index. It goes by the ticker USDOLLAR.
The main difference between the ICE futures dollar index and others is that the values may vary. Also, these other variations of the dollar index are not widely used. Hence, traders should be wary of using these products in their technical analysis. The purest correlation one can get is by using the ICE futures dollar index chart.
You may get to see some similarities for example when using the FXCM dollar index. But it may not hold at times.
This is something that traders should pay attention to. While all these different products are called the dollar index, you should read and find out what dollar index it refers to.
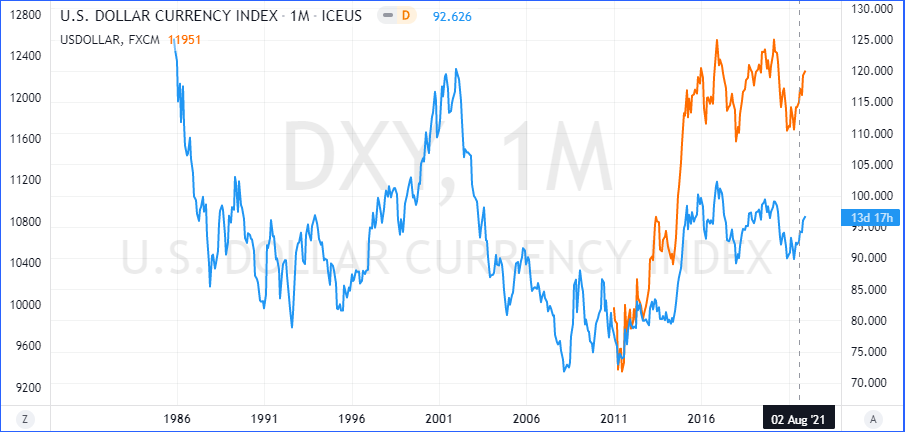
The above chart shows a comparison of the ICE Futures US Dollar index and FXCM’s USDOLLAR.
Notice that firstly there isn’t much history on the USDOLLAR.
Secondly, the price movements are also a bit off. While it is possible to gain some insights using the USDOLLAR, it will not yield the same results when you are studying the USDX chart for example.
Benefits of using the US Dollar index (DXY)
The US dollar index, or DXY, as you have learned is a trade-weighted index of the USD measured against six currencies.
The index shows the relative performance of the US dollar against this basket of currencies. Hence, from the index chart, one can assess whether the dollar will appreciate or depreciate.
Forex traders can use this information in their technical analysis to gain additional insights.
We should reiterate that the US dollar index will not give you any extra edge in the market. But since many retail traders do not use this method, it can put you at an advantage.
The dollar index is best if you are trading the EURUSD currency pair. This is due to the fact that the Euro has the largest share in the index.
The correlation tends to weaken as you move to other currencies that have a lower share.
Still, besides the Euro, the GBP and the JPY are also other currencies that you can study when using the dollar index chart. As you have learned, there are different variations of DXY, and they all go by the same name. Hence, ensure that the dollar index that you are studying is the ICE futures dollar index or its equivalent CFD product.
While other similar indexes provide somewhat similar price action trends, this is not always the case.