Bitcoin (XBT/USD) dropped massively to a fresh 2-year low on the liquidity crunch of FTX.com. FTX is a cryptocurrency exchange that came under scrutiny for concerns over the firms' balance sheets. Binance CEO and founder Changpeng “CZ” Zhao initially announced his intentions to rescue FTX.com. Later, Binance announced on its Twitter handle that it will not go ahead with the deal, and this roiled the crypto markets. With a resurgence of volatility and intense fear in the markets and ahead of the US inflation data due today, the S&P 500 also dropped with other big Indices.
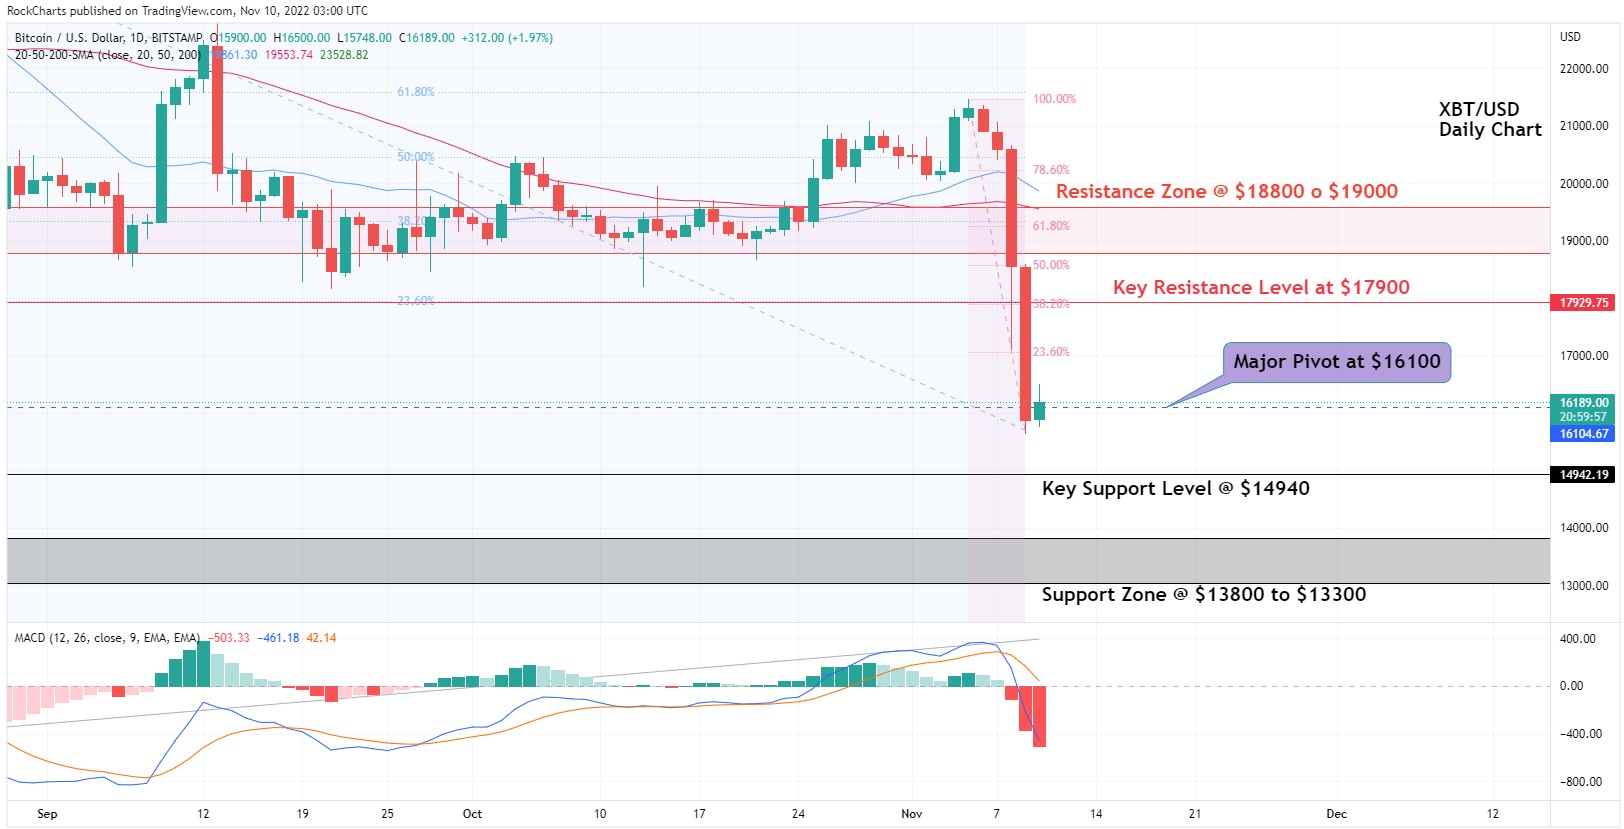
XBTUSD Chart Analysis – The XBTUSD chart shows that the pair is now trading just above the major Pivot at $16100. There could be a false recovery we might see here at this stage. The MACD indicator shows that the MACD blue line has dropped quite below the signal line showing high bearish momentum and could possibly also mean the pair is oversold. Prices are also trading quite below the 20, 50 and 200-day SMAs indicating a very bearish sentiment in the market. The pair could recover if it manages to stay above the $16K mark and it could decline further if it fails to drop below the $16K mark.
XBT/USD Chart Direction Bias – 1 Week
Trade Insights – XBT/USD
The chart shows viable short positions below the major pivot point of $16100 to first test the key support level at $14940. If Bitcoin drops below the key support level, then the pair could slide towards the Support zone at $13800 and $13300 and that could make the $10,000 price range for Bitcoin more plausible.
Alternatively, possible long positions above the pivot point at $16100 with the first target of the key resistance level at $17900 and then the test of the support zone between $18800 to $19000.