Market Insight – April 6th, 2022.
- · Bond yields rising after Hawkish Fed comments to drive down Inflation.
- · Early signs of Recession Risk!
Bond yields
US Treasury yields are hitting multiyear highs as Federal Governor Lael Brainard indicated yesterday. They are expecting a rapid balance sheet shrink with the combination of multiple interest rate rises. This makes the US monetary policy more neutral this year. It is said that Brainard normally favours an easy policy and low rates, but the economy needs stronger actions to tackle inflation at this stage.
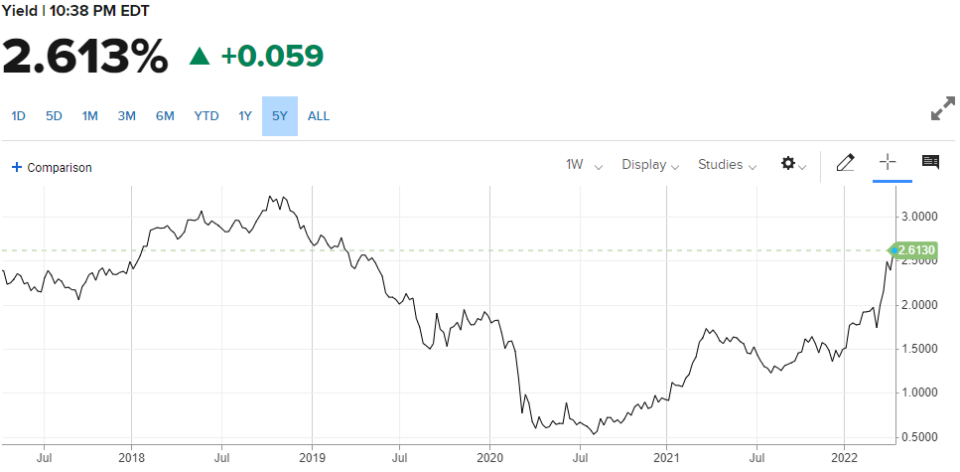
One of the signals of rising bond yields we need to focus on is the potential Recession. Historically, when the Yield curve reversal takes place, the recession follows. Investors doubt the near-term health of the economy and move away from short, dated bonds in favour of longer-dated debt. The Fed's actions of rapidly rising interest rates and quick shrinking of the balance sheet could become a hurdle to economic growth. The below chart shows that the yield curve inversions are unfolding. And it is rising vertically to test the peaks of 2018.

XAU/USD
XAU/USD pair is moving sideways since mid-March and still hovering just about the $1920 level. The gold price outlook looks mixed, and the chart indicates there could be indecisiveness amongst investors and the Gold could drop from here lacking a clear catalyst to push the prices higher.
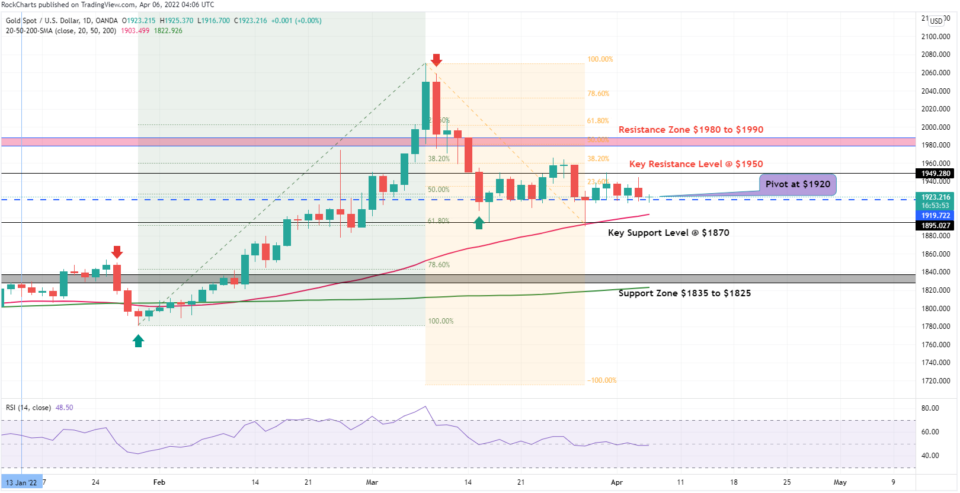
XAU/USD chart shows that gold prices are trading just above the Pivot at $1920.00 and could present opportunities for Short positions below the pivot to first test the key support level at $1870 and then the test of the Support Zone at $1835 to $1825 as the US bond yields rises further (Tradingview).
Alternatively, if prices stay above the pivot on the chart, then viable long positions above the Pivot point at $1920 to first test the Key resistance level at $1950 and then after breaking above to head towards the $1980 to $1990 resistance zone.
Click to see the Chart of The Week: Chart Of The Week - USD/JPY Approaches The Peak Of 2015!