S&P500
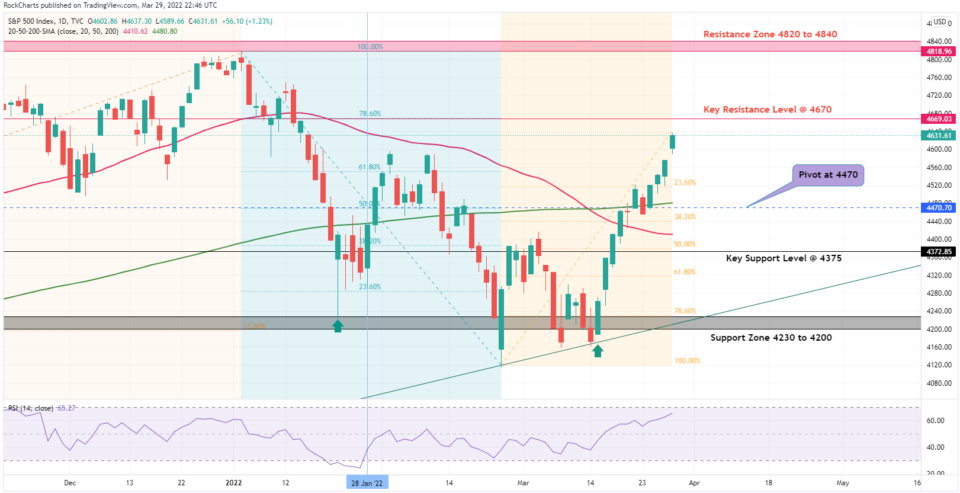
S&P 500 has moved higher as Gold and Oil have both dropped in yesterday’s session. In the light of geopolitical and fundamental risks and growing inflationary pressures, the Feds are adopting an aggressive approach to monetary tightening. As we move towards the end of the first quarter the American businesses will soon start to release forecasts for the new earing season and it is expected that companies may issue negative EPS guidance. Most downgrades could come from the Information technology sector and Industrial sector. If this scenario unfolds then this could become the catalysts for the Bears that they are looking for to push the markets lower towards the support levels.
US500 chart shows that it is heading towards the key resistance level at 4670 and could drop from here to first test the 4470 Pivot point to further head towards the key support level at 4375. There needs to be a strong catalyst to break the Investor optimism that is already present but has not emerged yet. Any failure in the peace talk between Ukraine and Russia and Negative EPS guidance from corporate America could become those catalysts.

USO/USD
As shown in last week's analysis the USO/USD pair has respected the resistance at $113 and dropped below the pivot at 104.00 towards $98 to later recover sharply back above the pivot. The covid-19 pandemic and Russian oil bans have pushed the oil prices above the $100 mark creating support at this level. Whereas, China's lockdown has pushed the prices down keeping them well below the resistance level at $120. (Trading View)
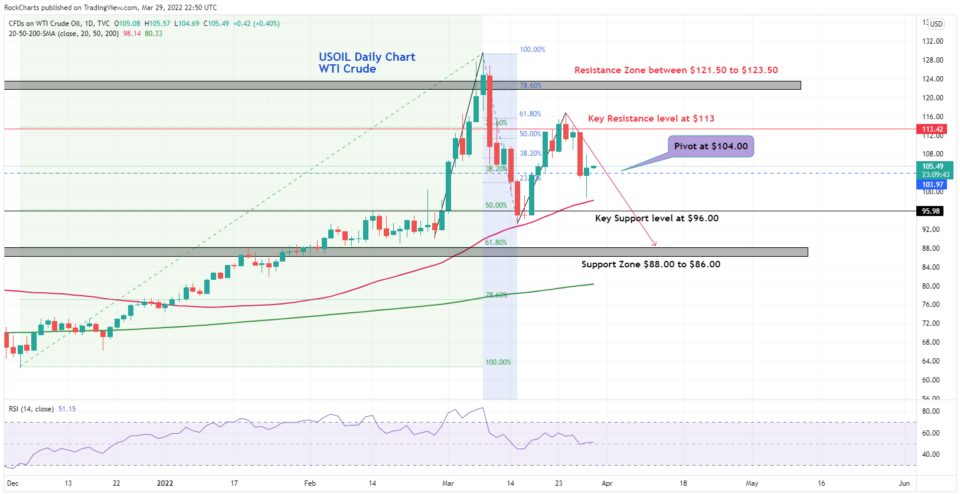
The USO/USD Chart shows that the WTI oil prices are trading just above the Pivot at 104.00 and could present an opportunity for Short positions below the pivot to first test the key support level at $96.00 and then the test of $88.00 to $86.00 as move peace talks news comes from the war zone.
Alternatively, if prices stay above the pivot on the chart, then viable long positions above the Pivot point at $104.00 to first test the Key resistance level at $113 and then after breaking above to head towards the $121 to $123 resistance zone.