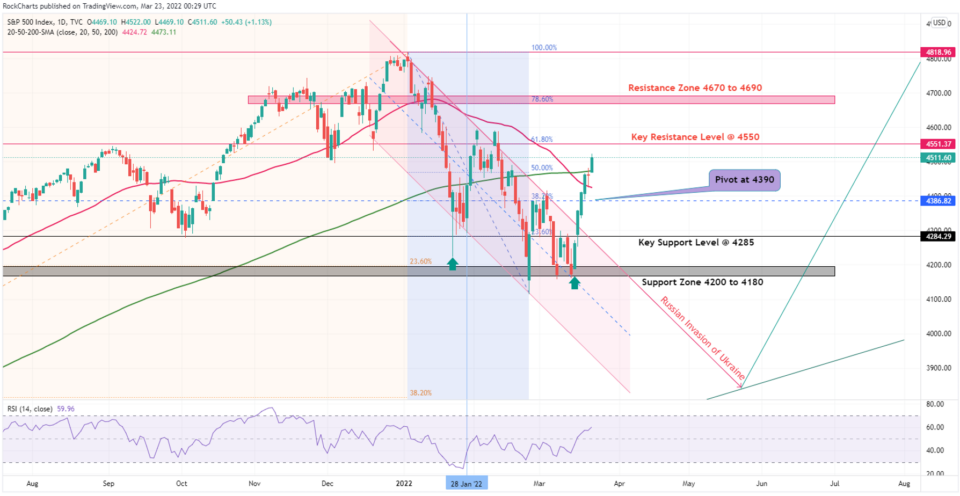
S&P 500 Recovery
S&P 500 has apparently found the inflection point and in the last week was up by 6%. A 6-day straight recovery starting on 15th March has moved the market above 4500 now, while investors are keeping one eye on the Hawkish Fed talk and the other on the Russian Invasion of Ukraine. It is becoming more apparent that the markets are choosing higher rates over higher inflation as later is more disadvantageous for the economy in the longer run. At the close of the NYSE, the Dow Jones (DJIA) climbed up by 0.74% to 34,807.46. S&P 500 jumped up by 1.13% to 4511.612 and the NASDAQ composite index was up by 1.95 % to 14,108.82. The CBOE Volatility Index has dropped down to just under 23 points now to 22.94 (TradingView).
In yesterday’s session (March 22, 2022), Meme-Stocks like GameStop surged. GME jumped up by 30% despite missing the earnings. AMC Entertainment was up 15% and Express Inc was up nearly 10%.

USO/USD
The Crude has recovered the lost ground by surging up by 18% in the past four sessions. Oil prices were boosted due to the news of the EU considering a ban on Russian oil imports and Saudi Arabia oil facilities were attacked by Iran-backed Houthi Rebels. On the other hand, China has relaxed the restrictions in the city of Shenzhen after a full week of lockdown.
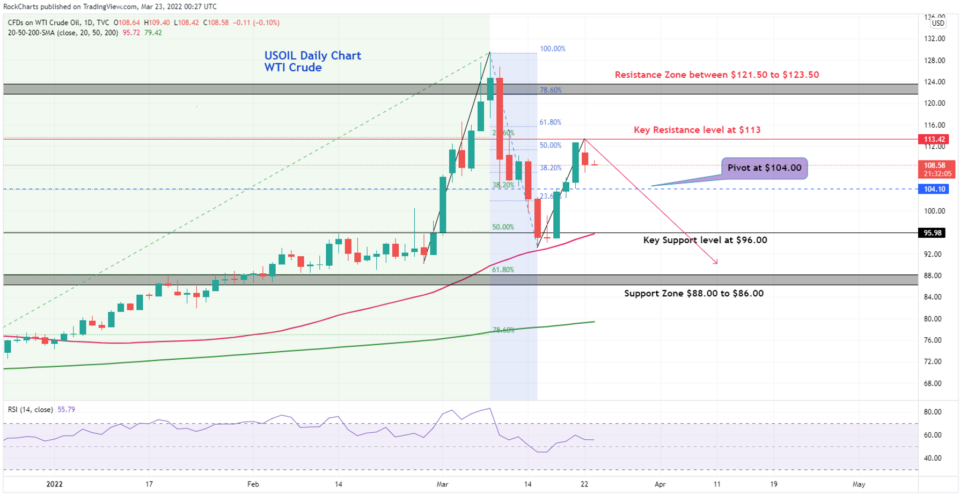
The chart shows that the oil prices have rebounded from the key support level of $96.00 in the chart jumping up by hitting the key resistance zone at $113. The prices are above the Pivot at $104 currently. The Resistance Zone shifted back up due to the rally between $121.50 to $123.50. There could be opportunities for short trades below the Key Resistance level at $113.00. The first target insight is $104 the key Pivot level and then the Key Support Level at $96. Alternatively, Long positions above the Key Resistance level at $113 targeting $121.50 to $123.50.
Click to see more about technical analysis the week: Chart of The Week - Technical Analysis - XBT/USD consolidation over?