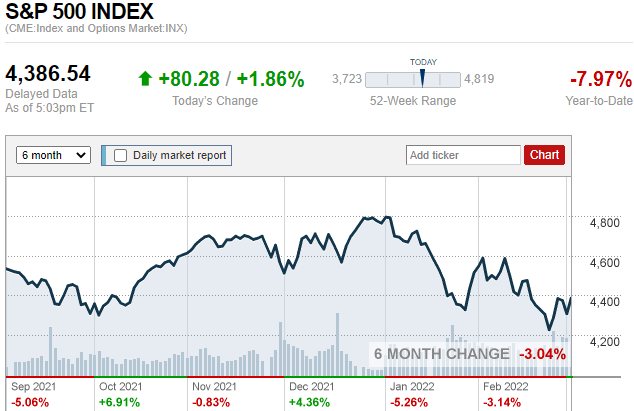
S&P500 dropped to 4116 the lowest in 9 months on 24th February when Russia entered Ukraine. There has been a recovery in the past few sessions and the index is currently at 4386.53. Regardless of the heightened possibility of complete invasion of Ukraine retail traders are betting for a rally ahead on the Dow Jones (33891.35) and S&P500 Index. Dow Jones is already up by 1.79% in yesterday’s session, S&P 500 up by 1.66%, and Nasdaq up by 1.62%. The CBOE Volatility Index, which measures the implied volatility of S&P500 options is down by 7.74% about 2.58 points to 30.74.

USO/USD - Oil prices reached (WTI Crude Oil) $112.59 per barrel a seven and a half year high a level not seen since 2014. International Energy Agency the IEA has assured the global oil markets that there will be no shortfall in supplies as markets fear Russian barrels will be stopped due to the Ukraine Invasion Crisis and additional sanctions that the West would continue to impose on Russia.
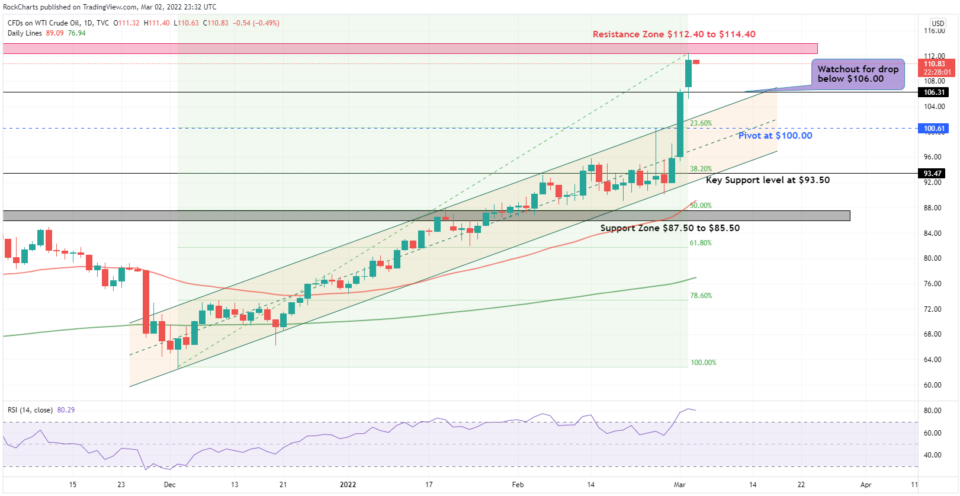
USO/USD Chart shows that the prices have broken above the upward parallel channel to hit a 7.5-year high level at the Resistance Zone at $112.40 to $114.40. The price could re-enter the upward channel if there are any signs of solution in the Ukraine Crisis. Any drop in the prices towards 106.00 could push the prices sharply lower to probably consolidate around the Pivot at 100.00.
Investors that are Long on Oil could further target the $115 to $120 level as prices are just sitting under the long-term Resistance Zone between 112.40 to 114.40 that oil touched about 7.5 years ago. The pair has already crossed the 80-point overbought limit on the RSI indicator and trading far from the 50 Day EMA Redline and 200 EMA Greenline levels.
XBT/USD – In the midst of the Ukraine crisis digital currencies have reasserted themselves are Safe-haven assets along with gold. When the investors hold cryptocurrency, they directly control the assets as they do when they invest in gold, and this removes the banks and governments from the equation helping people diversify away from the traditional system. The market cap of the largest digital coin by market value has grown to $836 billion now as other cryptocurrencies also advanced. As the war between Russia and Ukraine intensifies digital assets are also emerging as a potential vehicle for getting around sanctions and this could mean more trouble for Digital Currency in the future from regulators.
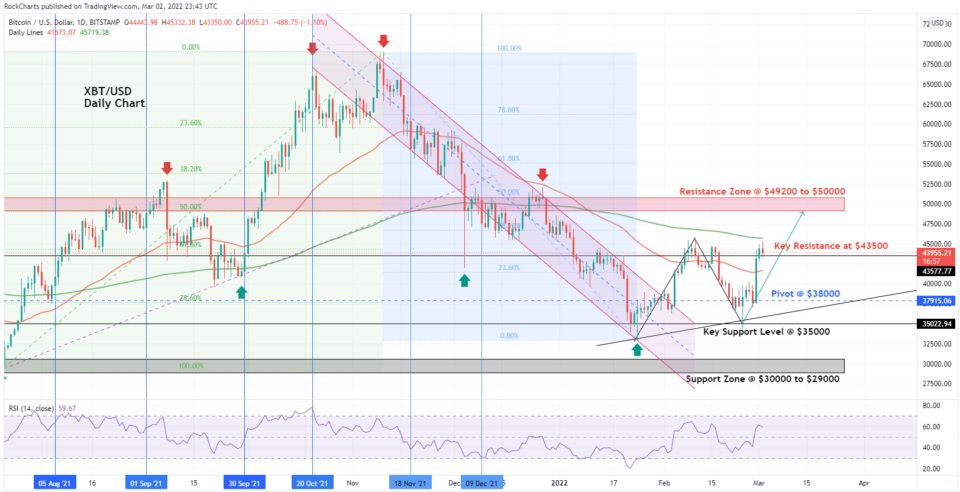
Trade Insights – XBT/USD –Viable Long positions above the Key Resistance Level $43500 targeting the Key Resistance at $49200 to $50000 and then later testing the Next Resistance level at $55000.
Alternatively, Short positions below the Key Resistance Level at $43500 on the chart to target $38000.
The chart shows that the prices have already moved above the Key Resistance level at $43500 and now consolidating at around $44000. Digital currencies could witness more upside and we could see prices could test the Resistance Zone between $49200 to $50000. Any move above $50000 would make the $55000 to $60000 resistance relevant.
Chart of The Week - Technical Analysis
EUR/USD -
- Resistance Zone: 114.50 to 114.80
- Key Resistance: 113.40
- Major Pivot Point: 112.10
- Key Support Level: 110.60
- Support Zone: 109.60 to 109.30
- Last Analysis Date: Blue Vertical Line
- 200 Day EMA – Green Line
- 50 Day EMA – Red Line
- CBOE VIX – Volatility Index @ 30.74 -2.58 (-7.74%)
Trade Insights – EUR/USD Forex pair – Chart shows viable Long positions above the Key Support level at 110.60, with the first target of the Pivot Point at 112.10 and then to hit the Key Resistance level at 113.40, to finally head towards Resistance Zone between 114.50 to 114.80.
Alternatively, Short positions below the Key Support level of 110.60 with the target of Support Zone between 109.60 t0 109.30
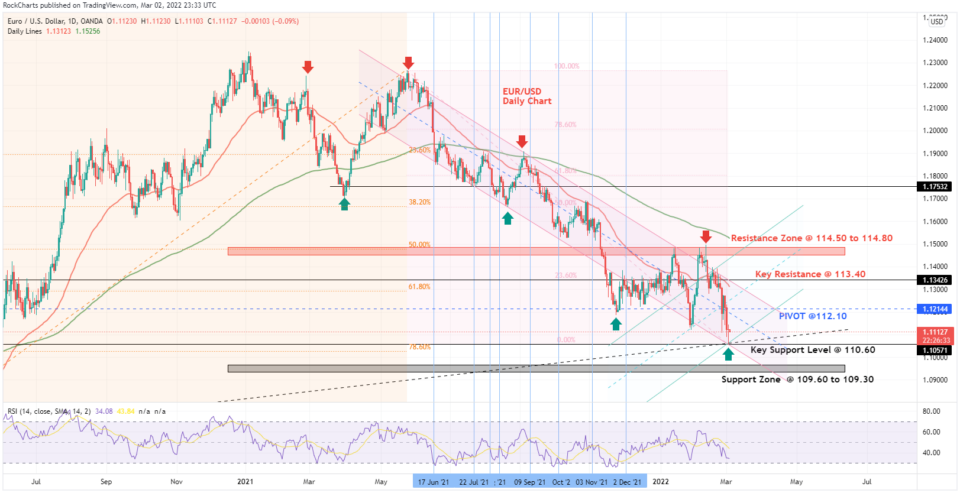
Chart Analysis:
Directional bias: 2 Weeks EUR/USD
EUR/USD chart shows the downward slide is of the pair is slowing down and the prices already moved out of the downward parallel channel once to renter quickly and falling sharply to touch $110.60 the Key Support Level the lower support level of the channel. Prices could jump up from here to move above the middle limit of the downward channel towards the pivot of 112.10.
Prices are trading quite below the 50 Day EMA and 200 Day EMA showing bearish sentiments of the market and strength of the USD. The RSI indicator is heading towards 30 points and ends up quickly in an oversold territory if the market is unable to hold the downfall.
Fundamental Overview: Investors’ sentiments have dampened over the past week and are weakening further due to the ongoing conflict between Russia and Ukraine. At this stage, no sanctions and penalty has managed to deter Putin and put a stop to the invasion of Ukraine, as Masses of refugees flee the country. Another confusion in the market is about the pace at which the interest rates could rise as along with inflation Central Bank face a renewed threat of instability due to the ongoing War next to the Eurozone. Higher fuel prices will cause an inflation uptick