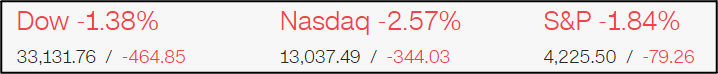
There are continued worries in the market about the increasing likelihood of invasion of Ukraine by Russia. 28 stocks out of the Dow Jones 30 index were down and the total fall was 1.38% about 464 points. The only sector that was in positive territory was Energy and Oil.
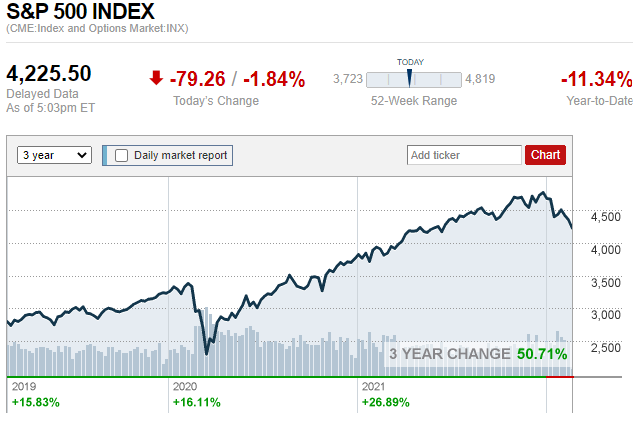
The S&P500 fell sharply by 1.84% down by another 79.26 points. The index dropped to touch 4224 yesterday about 11.9% lower than the January 3rd record high. Market re-entered the correction territory and if this would transpire into a bear market is to be seen! The other crucial index Nasdaq is already nearing the Bear market status as this Index is dominated by technology stocks, is now down by 19% below its record high of 15644.97 on 31st Dec.
The CBOE VIX index a popular measure of the stock market’s expectation of volatility based on S&P500 index options stands at 31.02 more than double the 14.84 it touched in November 2021. The spike in the volatility is due to the escalating tensions between Russia and Ukraine
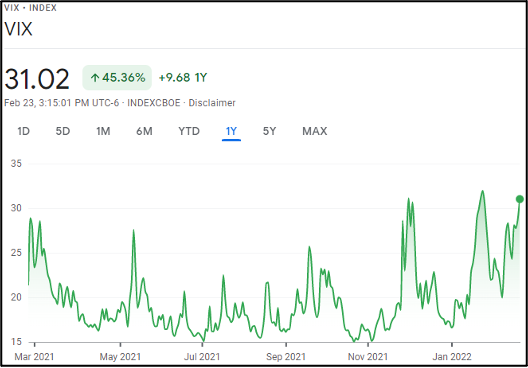
Chart of The Week - Technical Analysis
US500 Index
- Resistance Zone: 4570 to 4590
- Key Resistance: 4450
- Major Pivot Point: 4300
- Key Support Level: 4200
- Support Zone: 4020 to 4000
- Last Analysis Date: Blue Vertical Line
- 200 Day EMA – Green Line
- 50 Day EMA – Red Line
- CBOE VIX – Volatility Index @ 31.02 +2.21 (+7.67%)
Trade Insights – US500 Index – Chart shows viable short positions below the Key Support @ 4200, first targeting Support Zone at 4020 to 4000 and the next support cluster at 3810.
Alternatively, Long positions above the Key Support level at 4200 if the market consolidates here, to first target the Key Resistance level at 4450 and then the Resistance Zone at 4570 to 4590.
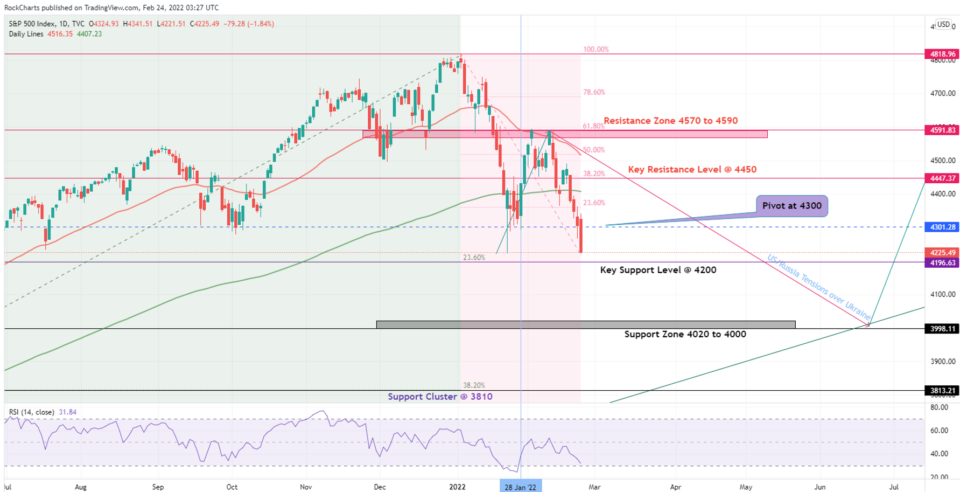
Chart Analysis:
Directional bias: 2 Weeks US500
US500 index dropped sharply yesterday to resume the correction territory that it came out of at the end of January. After dropping down to 4224 on 24th January the index retraced back to touch the 4595 level. Bulls strived to push through the resistance zone at 4570 to 4590 a couple of times to later give away the control to Bears who pushed the index down back to 4224. The drop this time over is not followed by any recovery and the session yesterday ended at the lowest point of the day.
US500 Index is now sitting just above the Fibonacci 23.60% on the chart and above the Key Support level at 4200 any drop and close of the session below this would push the prices further lower towards the Support Zone at 4020 to 4000.
The RSI indicator is heading towards 30 points and ends up quickly in an oversold territory if the market is unable to hold the onslaught. Prices are now well below the 50-Day EMA red the 200-day EMA green line indicating Bearish Bias of the market.
Fundamental Overview: Investors are selling out and looking for safe heaven shelter assets during warnings of an imminent Russian invasion of Ukraine and the worst security crises in Europe post-Cold War. The risk remains elevated as the VIX index has climbed up to 31 points. While the whole of the market is down, oil prices have surged to near the $100 mark per barrel and gold climbing to $1925 per ounce. The other factors like supply crunch, Covid 19 disruptions, policy tightening by US fed reserve are still at play.
XBT/USD
- Resistance Zone: $49200 to $50000
- Key Resistance: $43500
- Major Pivot Point: $38000
- Key Support Level: $35000
- Support Zone: $30000 to $29000
- Last Analysis Date: Blue Vertical Lines
- 200 Day EMA – Green Line
- 50 Day EMA – Red Line
- CBOE VIX – Volatility Index @ 31.02 +2.21 (+7.67%)
Trade Insights – XBT/USD –Viable Long positions above the Key Support Level at $35000 targeting the Key Resistance at $43500 and then later testing the Resistance Zone at $49200 to $50000
Alternatively, Short positions below the Key Support Level on the chart at $35000 to retest the current Support Zone at $30000 to 29000.
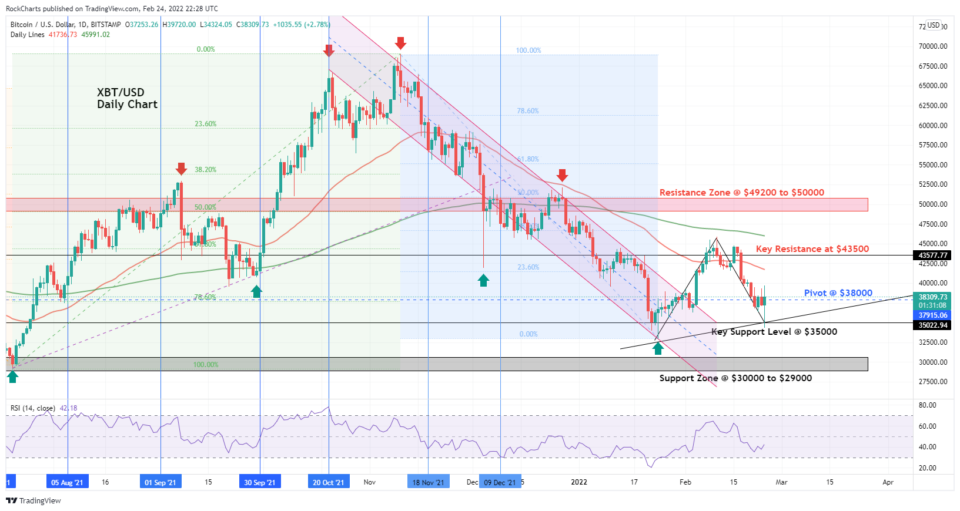
Chart Analysis:
Directional bias: 2 Weeks XBT/USD
XBTUSD is just trading above the Key support level at $35000 and seems the prices could drop below the support to later recover. Any recovery from here could be sharp to retrace back to the key resistance level at $43500. The major pivot point on the chart is at $38000 and there could be a confirmation for long positions if prices recover above this point.
RSI indicator is heading towards the 30 points and indicating buying opportunities are in sight. Prices are trading quite below the 50 Day EMA and 200 Day EMA levels indicating full swing bearish outlook of the market. It appears any recovery or drops from here is going to be sharp and sudden. Fundamental Overview: Bitcoin prices failed to stay above the $43500 level due to the ongoing uncertainty in the global markets and fears of the Russian Invasion of Ukraine. Bitcoin could now drop lower towards longer-term support zone. This has been an extremely volatile month for bitcoin and now selling pressure has become more apparent as investors rush towards haven assets.