Market Insight – 14th July 2022.
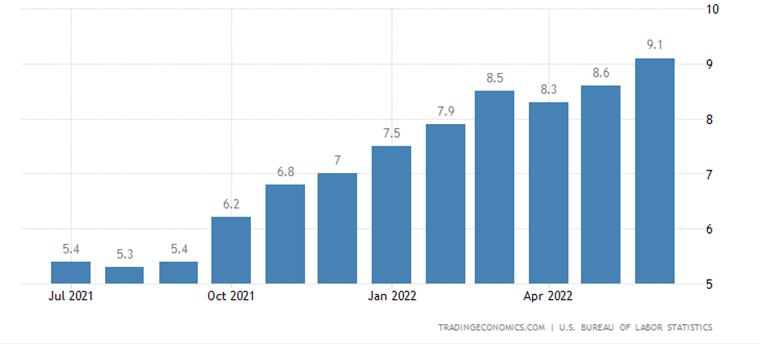
- S&P500 – US Inflation accelerated to 9.1% in June!
- Start of Earnings Season
- Potentially undervalued and Attractive Opportunities!
S&P 500 – The annual inflation rate in the US climbed up to 9.1% in June 2022 well above the market forecasts of 8.8%. It is the highest reading since November 1981. To combat this the Federal Reserve is expected to maintain a hawkish stance over the medium term and to raise benchmark interest rates by 75 basis points in its next policy meeting. On July 26-27. In June, the Feds increased the interest rates by 75 basis points.
In Wednesday’s session the S&P 500 declined by 0.45% to 3801, which is the fourth straight day drop. The Nasdaq was down by 0.15% to 11,247 and the Dow Jones was down by 0.67% to 30,772 points. The worse-than-expected CPI data triggered strong volatility in the markets. It is becoming more certain that the Federal Reserve could deliver a larger than anticipated interest rate increase in this month. As inflation is soaring to record levels. This week also marks the official start of the second quarter earnings season. And some big firms are going to release their financial results today. Skyrocketing inflation with the ongoing war, increasing interest rates and negative earnings revisions could spark the next leg down for the S&P 500.


Chart Analysis
The above S&P 500 chart shows that the index is still moving in the descending channel. After making another attempt to push higher out of the channel, the index dropped back inside. And it now trading under the Pivot at 3870. Which is proving to be a difficult resistance to break. The Index has formed higher lows patterns so far since touching the yearly low at 3636 points. If the prices drop below the 3710 Key Support level, this time on then we could see a test of the support Zone at 3580 to 3560 and beyond.
Trade Insights – US500
The chart shows Viable Short positions below the Pivot at 3870 with the target of Key Support Level at 3710. And then to head towards the support cluster is at 3580 to 3560.
Alternatively, Long positions above the Major Pivot point at 3870 with the target to head towards the Key Resistance level at 3970 and then towards the Resistance zone at 4050 to 4070
S&P 500 PE Ratio
The Benchmark S&P 500 Index has the worst start to the year in decades as the index has fallen more than 20% this year. Such broad market declines do offer potentially undervalued and attractive opportunities where most of the investors are fearful and not much euphoria is left in the markets. What investors can look out for is a value strategy focused on growth stocks where the stock prices are low compared to their expected earnings. The current S&P 500 PE ratio is at 19.21 it is still above the 15 PE ratio which is considered a fair value for most companies in real-world circumstances. The average P/E ratio for S&P500 for more than 200-year is 14 to 16.
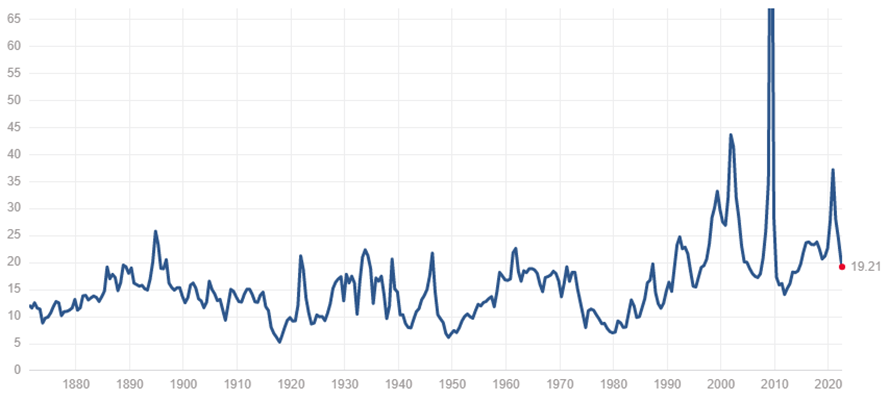
Current S&P 500 PE Ratio: 19.21 -0.09 (-0.45%)
| Mean: | 15.97 | |
| Median: | 14.89 | |
| Min: | 5.31 | (Dec 1917) |
| Max: | 123.73 | (May 2009) |
See Chart of the Week