GBP/USD
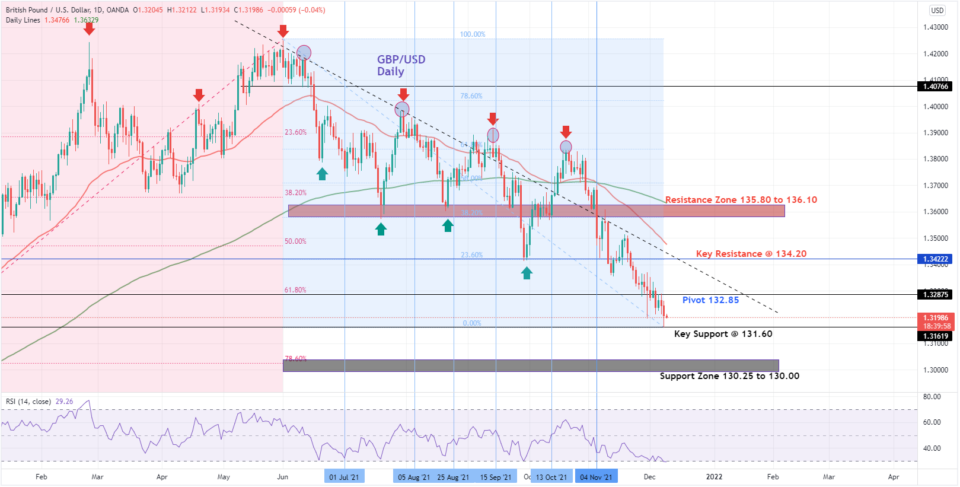
- Resistance Zone: 135.80 to 136.10
- Key Resistance Level: 134.20
- Major Pivot Point: 132.85
- Key Support Level: 131.60
- Support Zone: 130.25 to 130.00
- Last Analysis Date: Blue Vertical Lines
- 200 Day EMA – Green Line
- 50 Day EMA – Red Line
Trade Insights – GBP/USD – Chart shows Viable Long positions above the Major Pivot point at 132.85, targeting the key resistance level at 134.20 and then the next target of the resistance zone at 135.80 to 136.10
Alternatively, Short positions below the Key Support Leve at 131.60 targeting the Key Support level at 130.25 to 130.00.
GBPUSD Daily Chart
Chart Analysis:
Directional bias: 2 Weeks GBP/USD
The GBP/USD chart shows that the pair has now below our Support Zone at 134.00 that we saw in the last analysis on 4th November marked by the blue vertical line on the chart. This indicates the bearish bias of the market and the continuation of the ongoing Downtrend that started in October.
Support and Resistance levels have changed their places on the chart due to the recent developments and we can see that the Key support level is now shifted lower at 131.60 which was touched briefly in yesterday’s session. It is hard to say if this level will turn into an inflection point. The next few sessions however might give a better indication of where we are heading with the GBP.
Before taking any long positions, the Bulls could wait for the prices to move above the Pivot at 132.85, Once this is achieved then the target is at the Key Resistance level at 134.20 our previous support Zone level that could prove a bit hard to be broken. After consolidation around the Key Resistance level, we could see a further push by the Bulls towards the Resistance Zone at 135.80 to 136.10. For this scenario to unfold it requires a strong catalyst to change the direction of all the major currency pairs against the strong dollar. If the downtrend is to be continued for a few more sessions, then short positions below the Key Support level at 134.60 targeting the Support Zone at 130.25 to 130.00. The pair is now trading far from the 50 Day EMA and 200 Day EMA levels indicating strong bearish sentiments prevailing in the market. Plus RSI indicates an oversold scenario of the pair at 30 RSI points.
Fundamental Overview: The month of the Year tends to be slower for the Dollar where other major pairs and gold gains the ground, this could be time for GBP to rise back to test the resistance levels. The inflection point for GBP is apparently just around the corner and December could prove to be a bullish month for the GBP/USD pair if we reflect on the seasonality factor. Other Factors like Interest rates, Omicron variant of Covid 19, and Economic Data could also become a catalyst to take the pair in either direction.
XBT/USD
- Resistance Zone: $58550 to $59850
- Key Resistance: $55600
- Major Pivot Point: $52200
- Key Support Level: $48150
- Support Zone: $48900 to $47900
- Last Analysis Date: Blue Vertical Lines
- 200 Day EMA – Green Line
- 50 Day EMA – Red Line
Trade Insights – XBT/USD –Viable Long positions above the Key Support level at $48150 targeting the Major Pivot at $52200, then the Key Resistance level at $55600. Once this is achieved the Bulls can test the Resistance Zone between $58550 to $59850.
Alternatively, Short positions below the Key Support level on the chart at $48150 with the target of the Support Zone at $44400 to $43150.
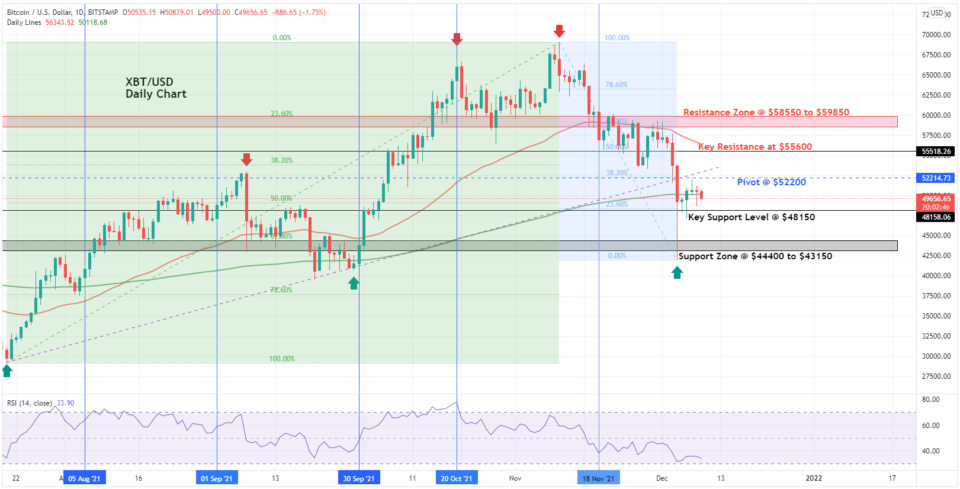
Chart Analysis:
Directional bias: 2 Weeks XBT/USD
XBT/USD pair has dropped from the peak of $69000 to touch the trough at $42000 just in a span of a month starting 10th November. This goes on to show that how volatile BTC is and risky as an investment instrument. The trough at $42000 has reconfirmed our earlier Support Zone around $44000 as there was a quick follow-up recovery after the pair dropped and hit the level. The recovery pushed the prices to almost touching our Pivot on the chart $52200 also the 38.20% Fibonacci level on the chart. There are chances of more upside for BTC above the Key Support level at $48150. Bulls could move the price above the Pivot at $52200 to test the Key Resistance Zone at $55600. Also, the meeting point of our 50.00% Fibonacci level is on the chart.
It is unlikely at this stage that the pair could move above the Resistance Zone and try to move above the November high however, a $5500 target is doable and could be achieved in the next few sessions by the Bulls if taken charge over from the Bears.
The pair is trading just around the 200-Day EMA level now and well below the 50-day EMA lines indicating the Bearish bias of the market. In case of more weakness in the Cryptocurrency market, the prices could quickly drop below the key support level at $448150 and head South to test the Support Zone at $44400 to $43150. The worse could start to unfold if this support zone is broken to bring back the $30000 mark in the picture that is also a strong demand zone BTC investors.
Fundamental Overview: Bitcoin melted sharply on Friday and Saturday last week due to the threats of the Omicron variant and the increasing probability of accelerated Fed Tapering. The sell-off happened as the markets rolled over into Asian trading hours and due to the lack of liquidity, the support break, led to sharp losses across the board with some exchanges showing Bitcoin spiking to a low just above $42k. A long period of consolidation is needed before we could see investors pushing the prices back towards the $60K mark.